MRM Example 1: City of Celina Detention Sizing
This walkthrough demonstrates how to set up a Modified Rational Method (MRM) detention sizing analysis in HydraLink, based on the City of Celina, Texas design guidelines. The example models a 10-acre development site that must detain the difference between post-development and pre-development peak flows for the 100-year storm event. The results from this example match the City of Celina’s required detention volume, confirming the methodology implemented in HydraLink.
Scenario Description
Site Conditions
| Parameter | Pre-Development | Post-Development |
|---|---|---|
| Total Area | 10 acres | 10 acres |
| Runoff Coefficient (C) | 0.30 | 0.70 |
| Time of Concentration (Tc) | 20 min | 10 min |
Design Storm: 100-year event
Location: Celina, Texas (Collin County), coordinates 33.313°N, 96.788°W
Detention Method: Standard
Atlas 14 Interpolation: Linear
Post-development sub-basins: Basin A-1 (6 ac, C=0.70, Tc=10 min) and Basin A-2 (4 ac, C=0.70, Tc=10 min)
The post-development site is divided into two sub-basins (A-1 and A-2) that drain to a common detention pond. The pre-development basin (Rational Basin 1) establishes the allowable release rate. This setup demonstrates how HydraLink combines multiple Rational basins into a single MRM detention calculation using basin roles.
1 Create a New Project
HydraLink opens on an empty project; if one is already open, click New on the
Home tab (or press Ctrl+N). Navigate the map to the Celina, Texas
area.
2 Enter Project Information
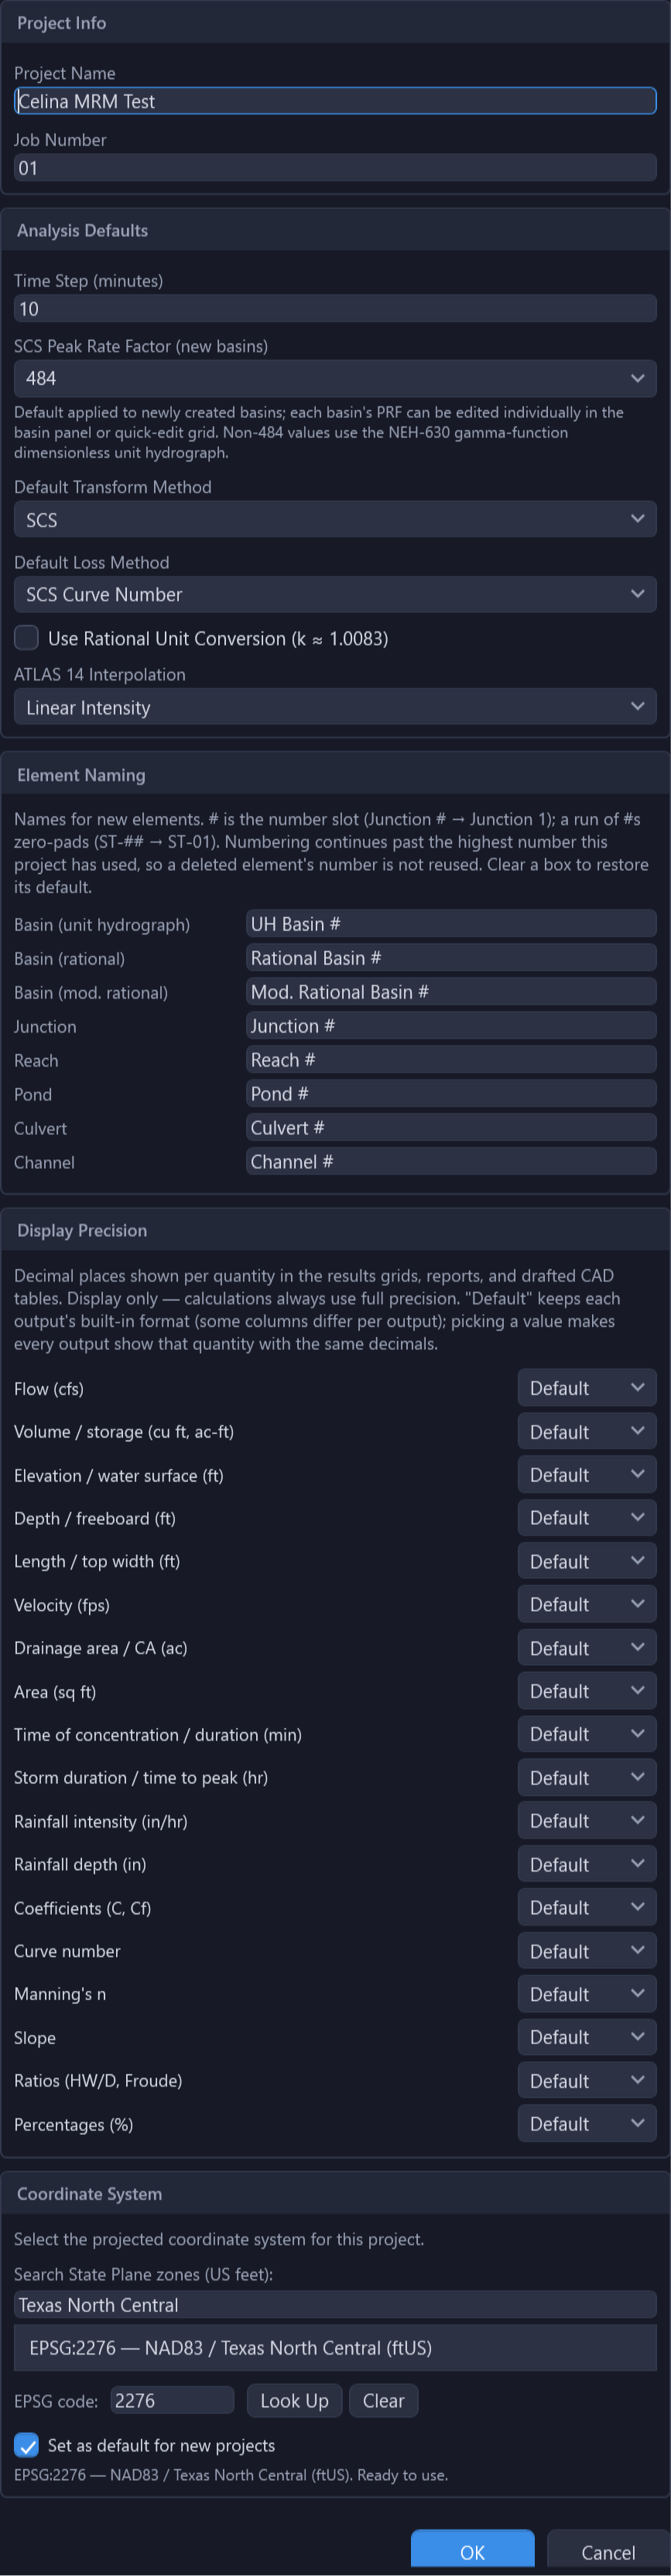
Click Settings on the Home tab to open Project Settings, and enter a project name and job number. For this example:
- Project Name: Celina MRM Test
- Job Number: 01
3 Set Up the Storm Event
Click Storm in the Model ribbon tab to open the Storm Configuration dialog, and stay on the Intensity Based tab, since this example is a Rational / Modified Rational model.
- Select the 100-yr return period checkbox.
- The rainfall intensity data is based on NOAA Atlas 14 values as published in the City of Celina design manual. Type the intensities into the duration table, or use NOAA Atlas 14 to fetch precipitation frequency estimates for the Celina area.
- Under Intensity Method, choose Interpolate from the table and set the mode to Linear. The City of Celina’s example uses linear interpolation of the Atlas 14 depth-duration data, and selecting this option in HydraLink matches their methodology exactly.
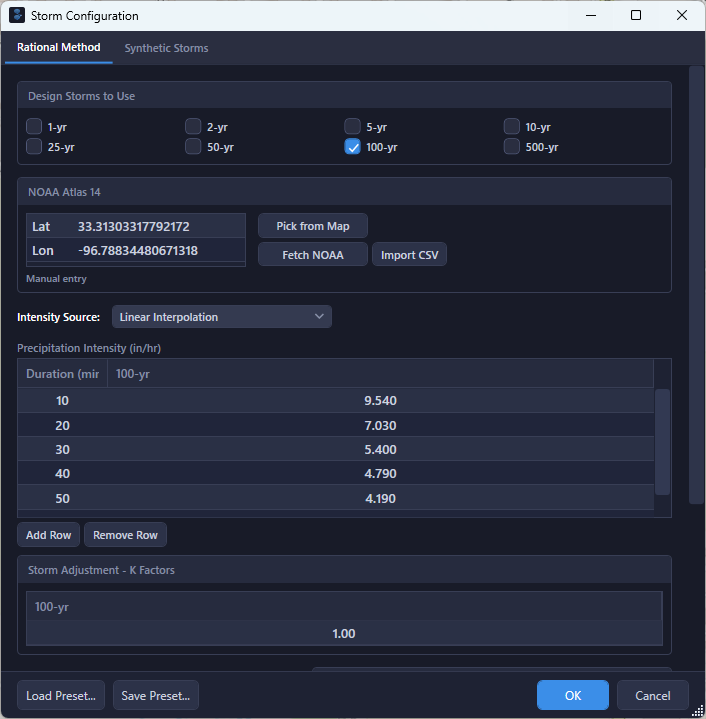
Interpolation recommendation: Linear interpolation was used in this example to match the City of Celina’s published numbers. In general practice, we recommend using log-log interpolation, which provides a better curve fit to ATLAS 14 depth-duration-frequency data.
IDF Data for This Example
| Duration | Intensity (in/hr) |
|---|---|
| 10 min | 9.54 |
| 20 min | 7.03 |
| 30 min | 5.40 |
| 40 min | 4.79 |
| 50 min | 4.19 |
| 60 min | 3.58 |
4 Create the Pre-Development Plan
HydraLink uses plans to organize pre-development and post-development conditions within the same project file. Each plan has its own set of elements and can share elements across plans via linking.
- In the Plans tab of the ribbon toolbar, rename the default Plan 1 to Pre.
- Open the basin dropdown on the Model tab, choose Rational,
and drag a basin onto the map. Configure it with the pre-development parameters:
- Name: Rational Basin 1
- Area: 10 acres
- Runoff Coefficient (C): 0.30
- Time of Concentration (Tc): 20 minutes
- Add a Junction (Junction 1) downstream of the basin. This junction will serve as the common outlet; tick Share across plans in its properties so the same junction exists in the post-development plan.
- Set the basin’s Drains To to Junction 1.
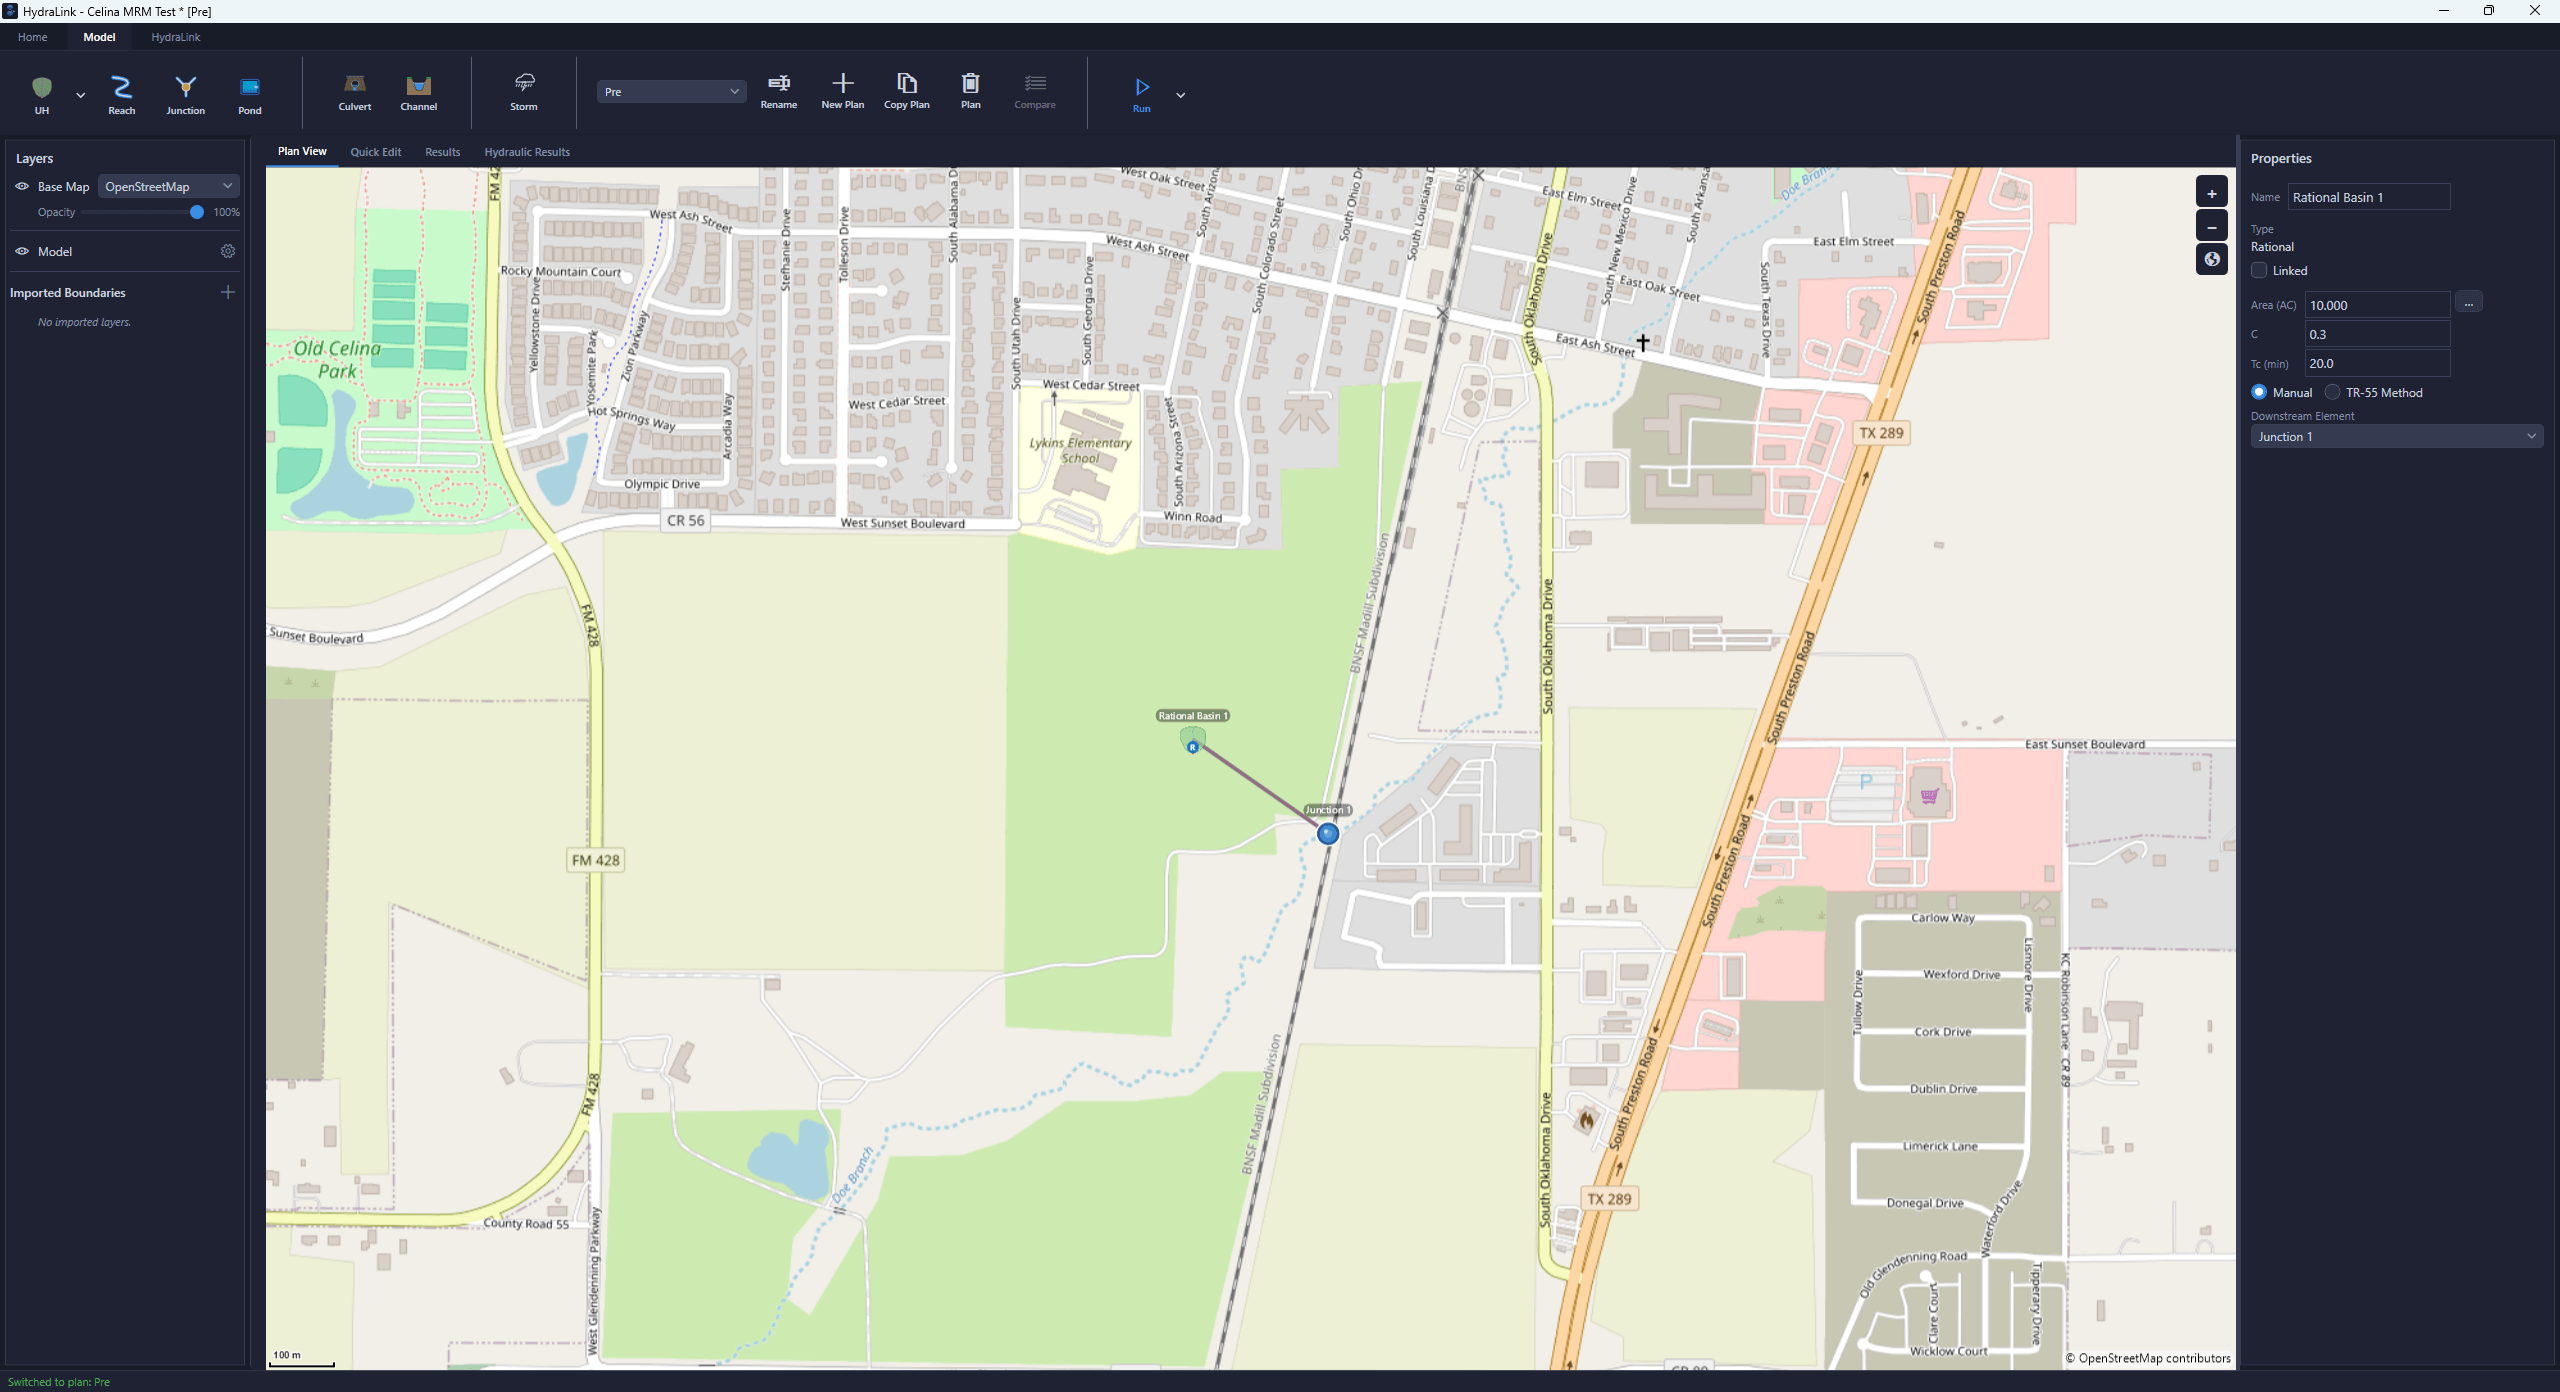
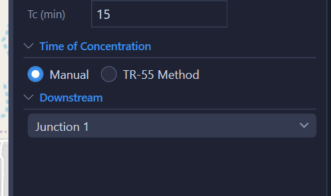
Why use a junction? The junction acts as the network outlet point that is shared between plans. By linking Junction 1 across both plans, the pre-development and post-development networks share a common discharge point. This also ensures the pre-development basin is available in the post-development plan for assigning its MRM role as the target basin.
5 Create the Post-Development Plan
- Click New Plan in the Plans tab to create a second plan. Name it Post.
- The linked Junction 1 from the Pre plan will already appear in the Post plan.
- Add two Rational Basins representing the developed sub-areas:
- Basin A-1: Rational, Area = 6 acres, C = 0.70, Tc = 10 min
- Basin A-2: Rational, Area = 4 acres, C = 0.70, Tc = 10 min
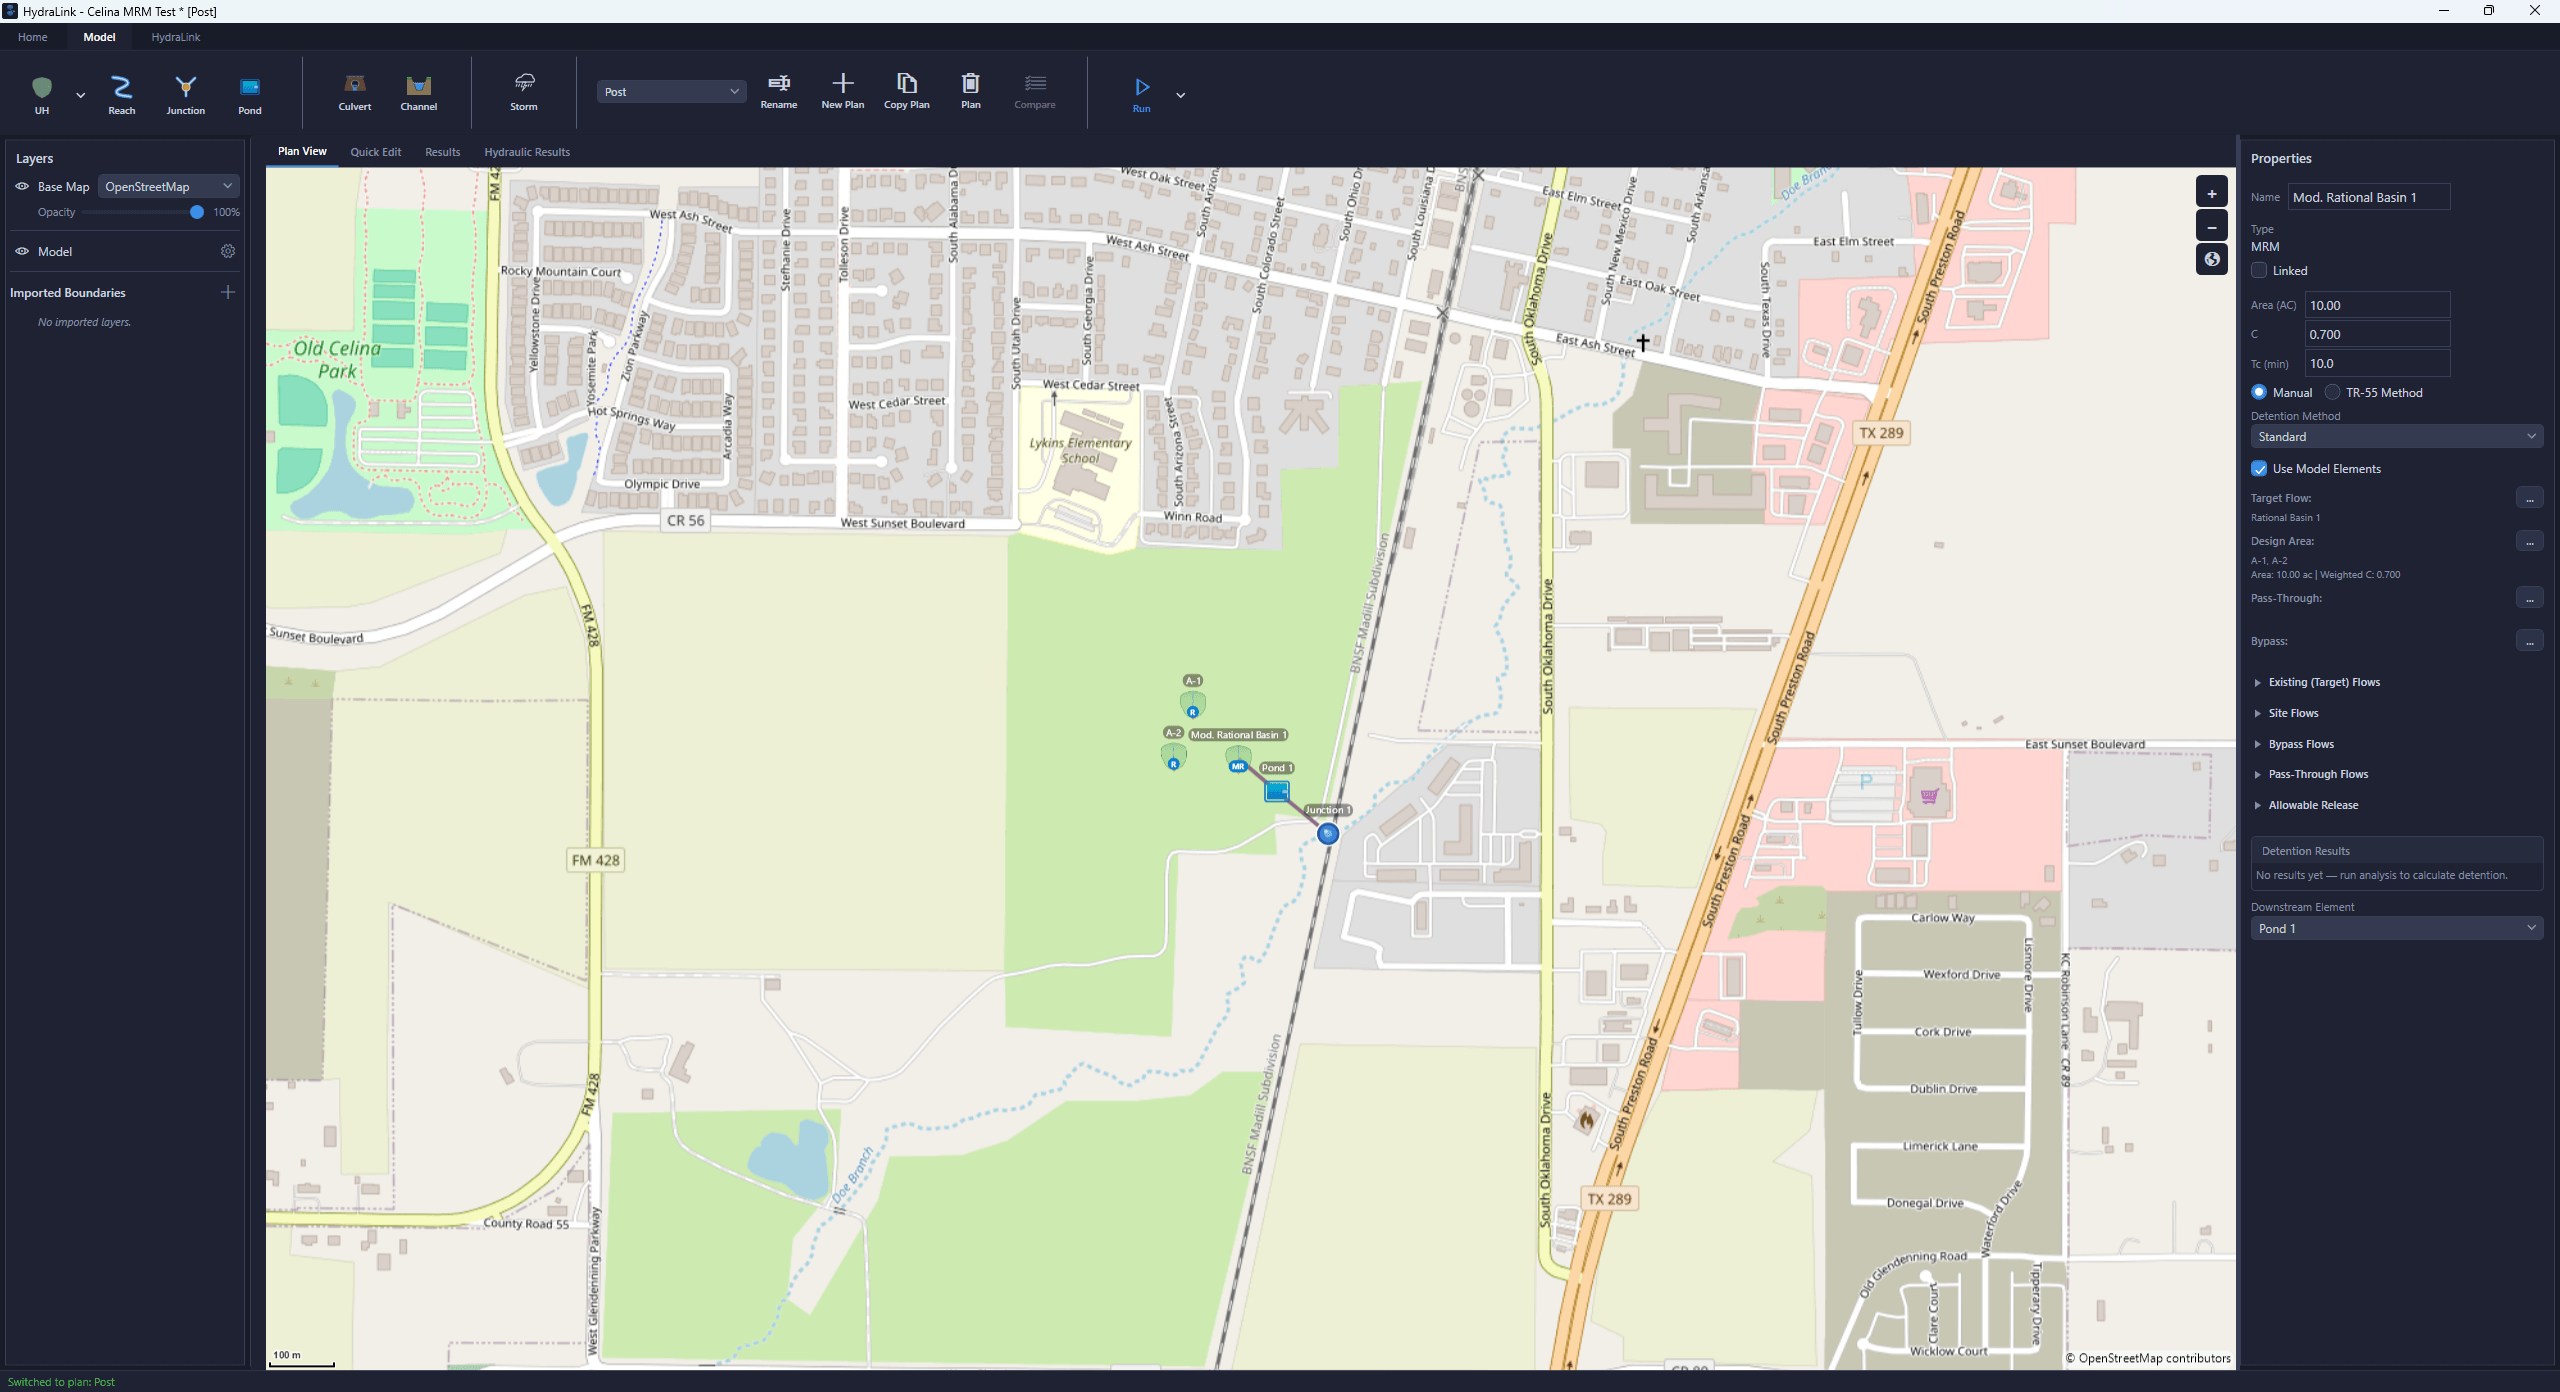
Multiple Sub-Basins
Splitting the post-development area into sub-basins (A-1 and A-2) is common when different portions of a site drain to the pond from different directions or have different land uses. In this example both sub-basins happen to share the same C and Tc values, but in practice each could differ. The MRM basin combines them into a single design area: the areas add, the runoff coefficient is area-weighted, and the time of concentration is the longest of the sub-basins, since that is how long water takes to arrive from the most distant point.
6 Add the MRM Basin and Assign Roles
The MRM basin is the element that computes the required detention volume. It does not represent a physical drainage area itself; instead, it references other Rational basins in the project and assigns each a role in the detention calculation.
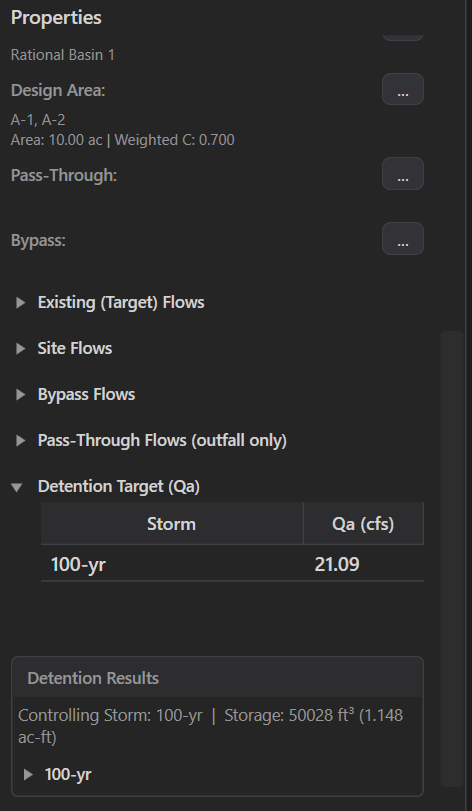
- In the Post plan, choose MRM from the basin dropdown on the Model tab and drag a basin onto the map. Name it Mod. Rational Basin 1.
- Set the Detention Method to Standard.
- Enable Use Model Elements so the MRM basin references other basins in the project rather than requiring manual entry of composite parameters.
- Assign basin roles:
Basin Role Purpose Rational Basin 1 (Pre plan) Target Its peak flow defines the allowable release rate A-1 (Post plan) Design Area Post-development area draining to the pond A-2 (Post plan) Design Area Post-development area draining to the pond
Understanding Basin Roles
| Role | What It Does |
|---|---|
| Target | The pre-development basin whose peak Rational Method flow (Q = CiA) sets the allowable release rate from the detention pond. This is the maximum flow the site is permitted to discharge. |
| Design Area | Post-development basins whose combined area and weighted C value define the inflow to the detention facility. The MRM iterates storm durations to find the critical volume difference between inflow and allowable outflow. |
| Bypass | Flow from the site that does not enter the detention pond. Bypass flow reduces the amount of flow that the detention pond must control. See the Bypass & Pass-Through Flows section below. |
| Pass-Through | Off-site flow that passes through the detention pond but is not detained. The outfall structure must be sized to convey pass-through flow in addition to the allowable detained release. See the Bypass & Pass-Through Flows section below. |
7 Run the Solver for MRM Sizing
Before designing the pond, run the solver to compute the required detention volume. Click the Run button in the Model ribbon tab. You can run the active plan or all plans at once using the split-button dropdown. HydraLink will:
- Solve the Pre plan, computing Rational Basin 1’s peak flow (the allowable release rate).
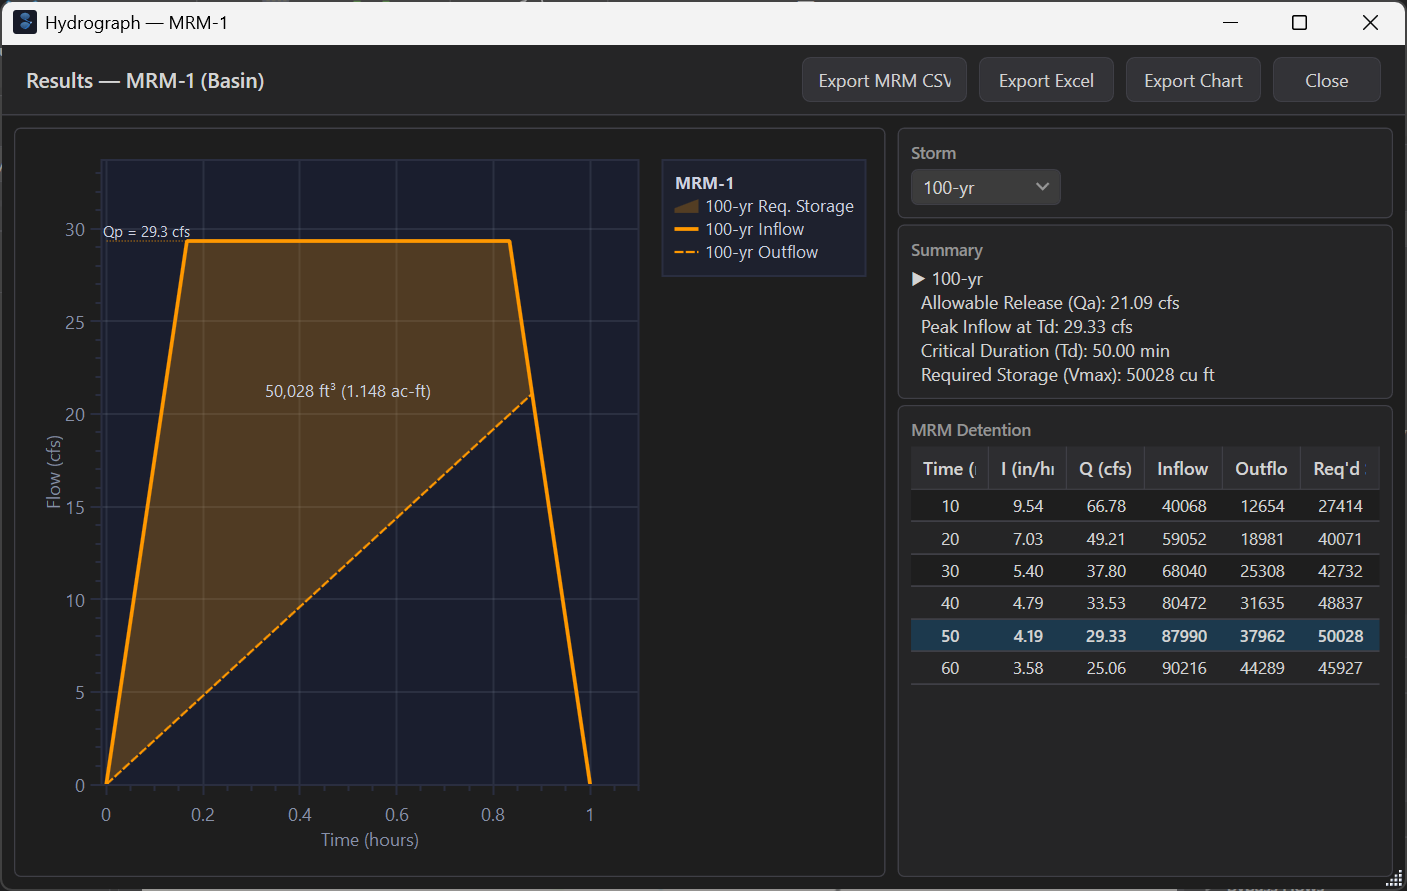
- Solve the Post plan, computing the Rational peak flows for A-1 and A-2, then running the MRM iteration on Mod. Rational Basin 1 to find the required detention volume at the critical storm duration.
The results from this example match the City of Celina’s required detention volume for this site configuration, confirming that HydraLink’s Standard MRM implementation with linear Atlas 14 interpolation produces the correct values against the city’s published example.
8 Design the Detention Pond
With the required volume known, the next step is to design the physical pond. Add a Pond element downstream of the MRM basin and upstream of Junction 1. When the MRM basin’s Drains To is a pond, the MRM design criteria (required volume, allowable release rate, and storm event) are automatically passed to the pond for use in the outlet design analysis.
An MRM basin passes flow downstream only through a pond. If its Drains To is a junction or a reach, nothing continues and the solver warns.
- Place a Pond on the map and name it Pond 1.
- Set the MRM basin’s Drains To to Pond 1.
- Set Pond 1’s Drains To to Junction 1.
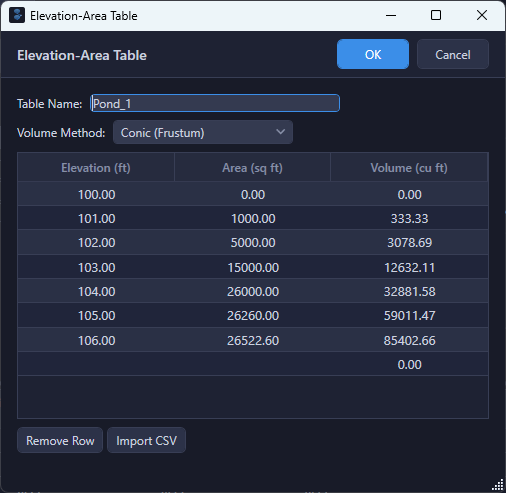
- Configure the pond’s stage-storage (elevation-area) table using the required volume
from Step 7 to guide your pond geometry. The pond must provide at least the required storage.
For this example:
Elevation (ft) Area (ft²) 100 0 101 1,000 102 5,000 103 15,000 104 26,000 105 26,260 106 26,523 - Design the outlet structure. The Pond Design dialog will show the MRM design criteria so you can verify the outlet releases no more than the allowable rate at the required storage elevation.
Outlet Sizing: Getting It Right
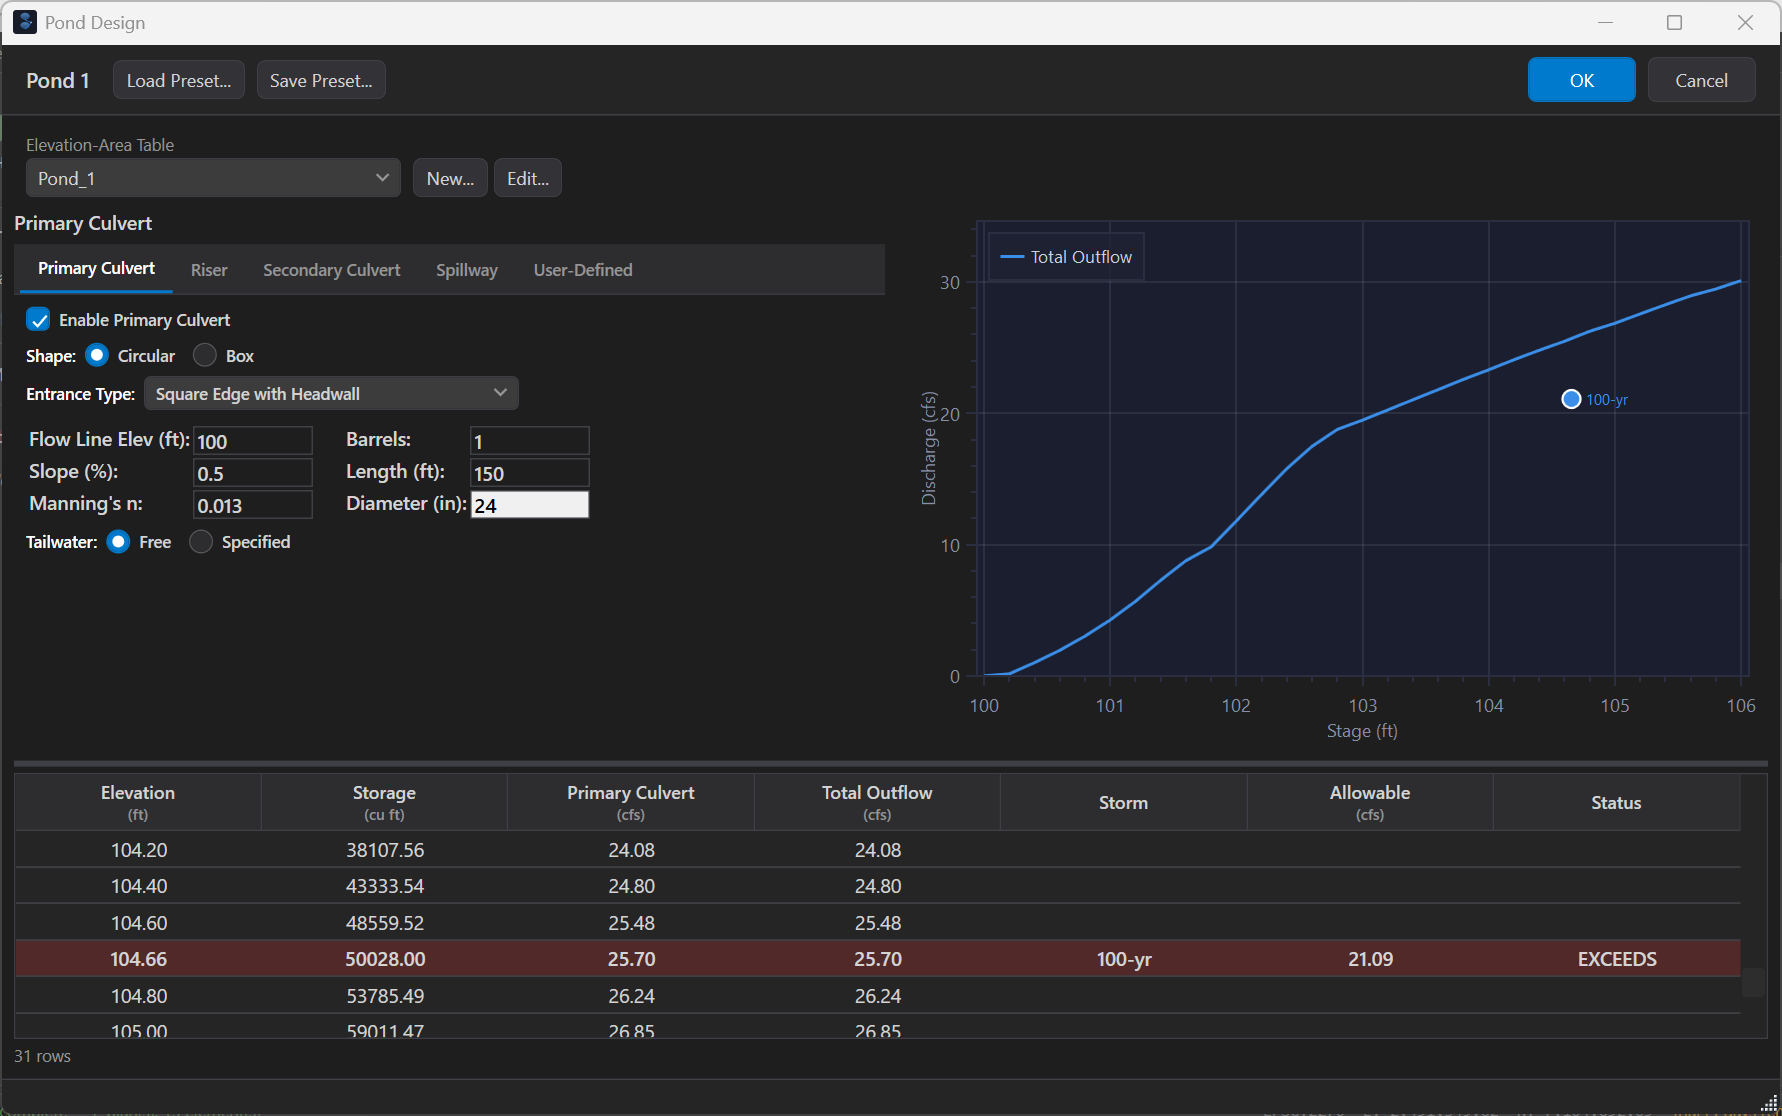
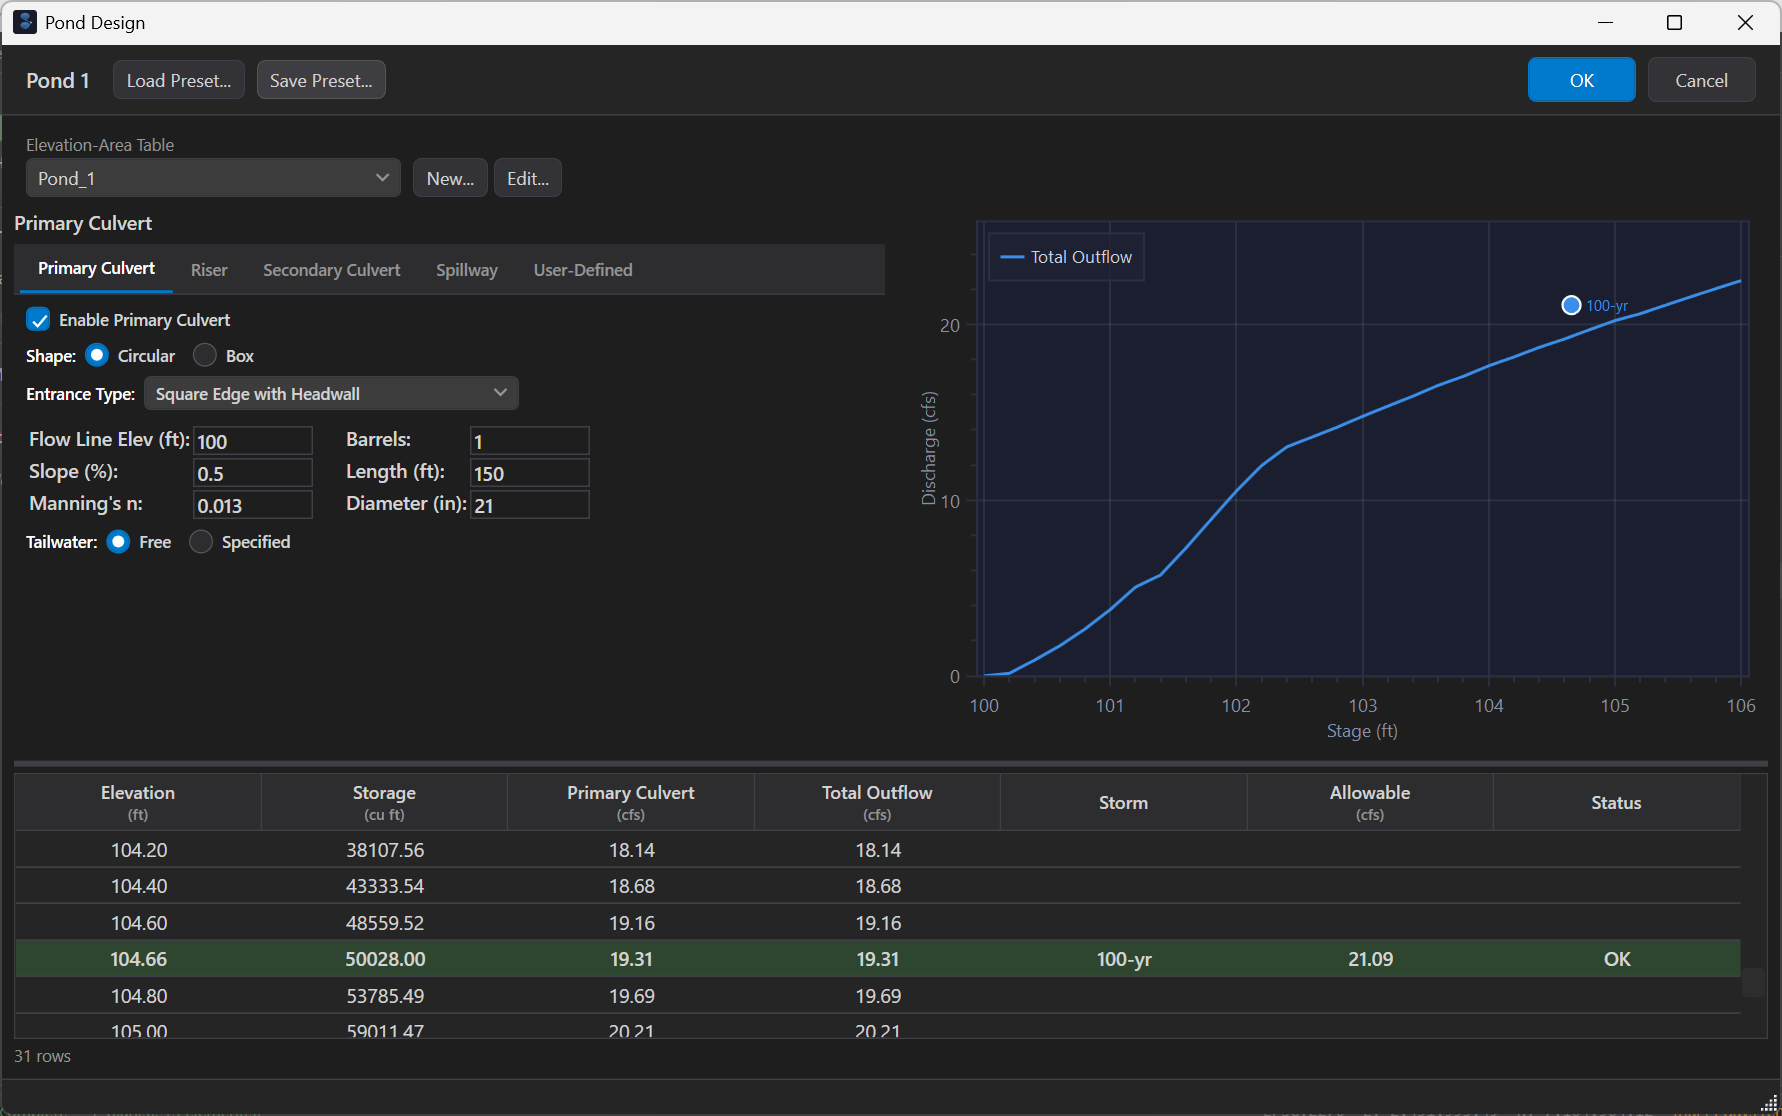
The outlet structure must be sized so that the discharge at the required storage elevation does not exceed the allowable release rate. HydraLink’s Pond Design dialog shows this visually with the stage-discharge curve and a design point marker for each storm event. The stage-discharge table highlights the row at the required storage volume in red if the outflow exceeds the allowable rate, green if it passes.
With a 24-inch RCP outlet, the discharge at the required storage elevation (104.66 ft, 50,028 ft³) is 25.70 cfs, exceeding the 21.09 cfs allowable release rate. The stage-discharge curve passes above the design point, and the table row is highlighted red:
Reducing the outlet to a 21-inch RCP brings the discharge at the same elevation down to 19.31 cfs, below the 21.09 cfs allowable rate. The curve stays below the design point, and the table row is highlighted green:
9 Network Summary
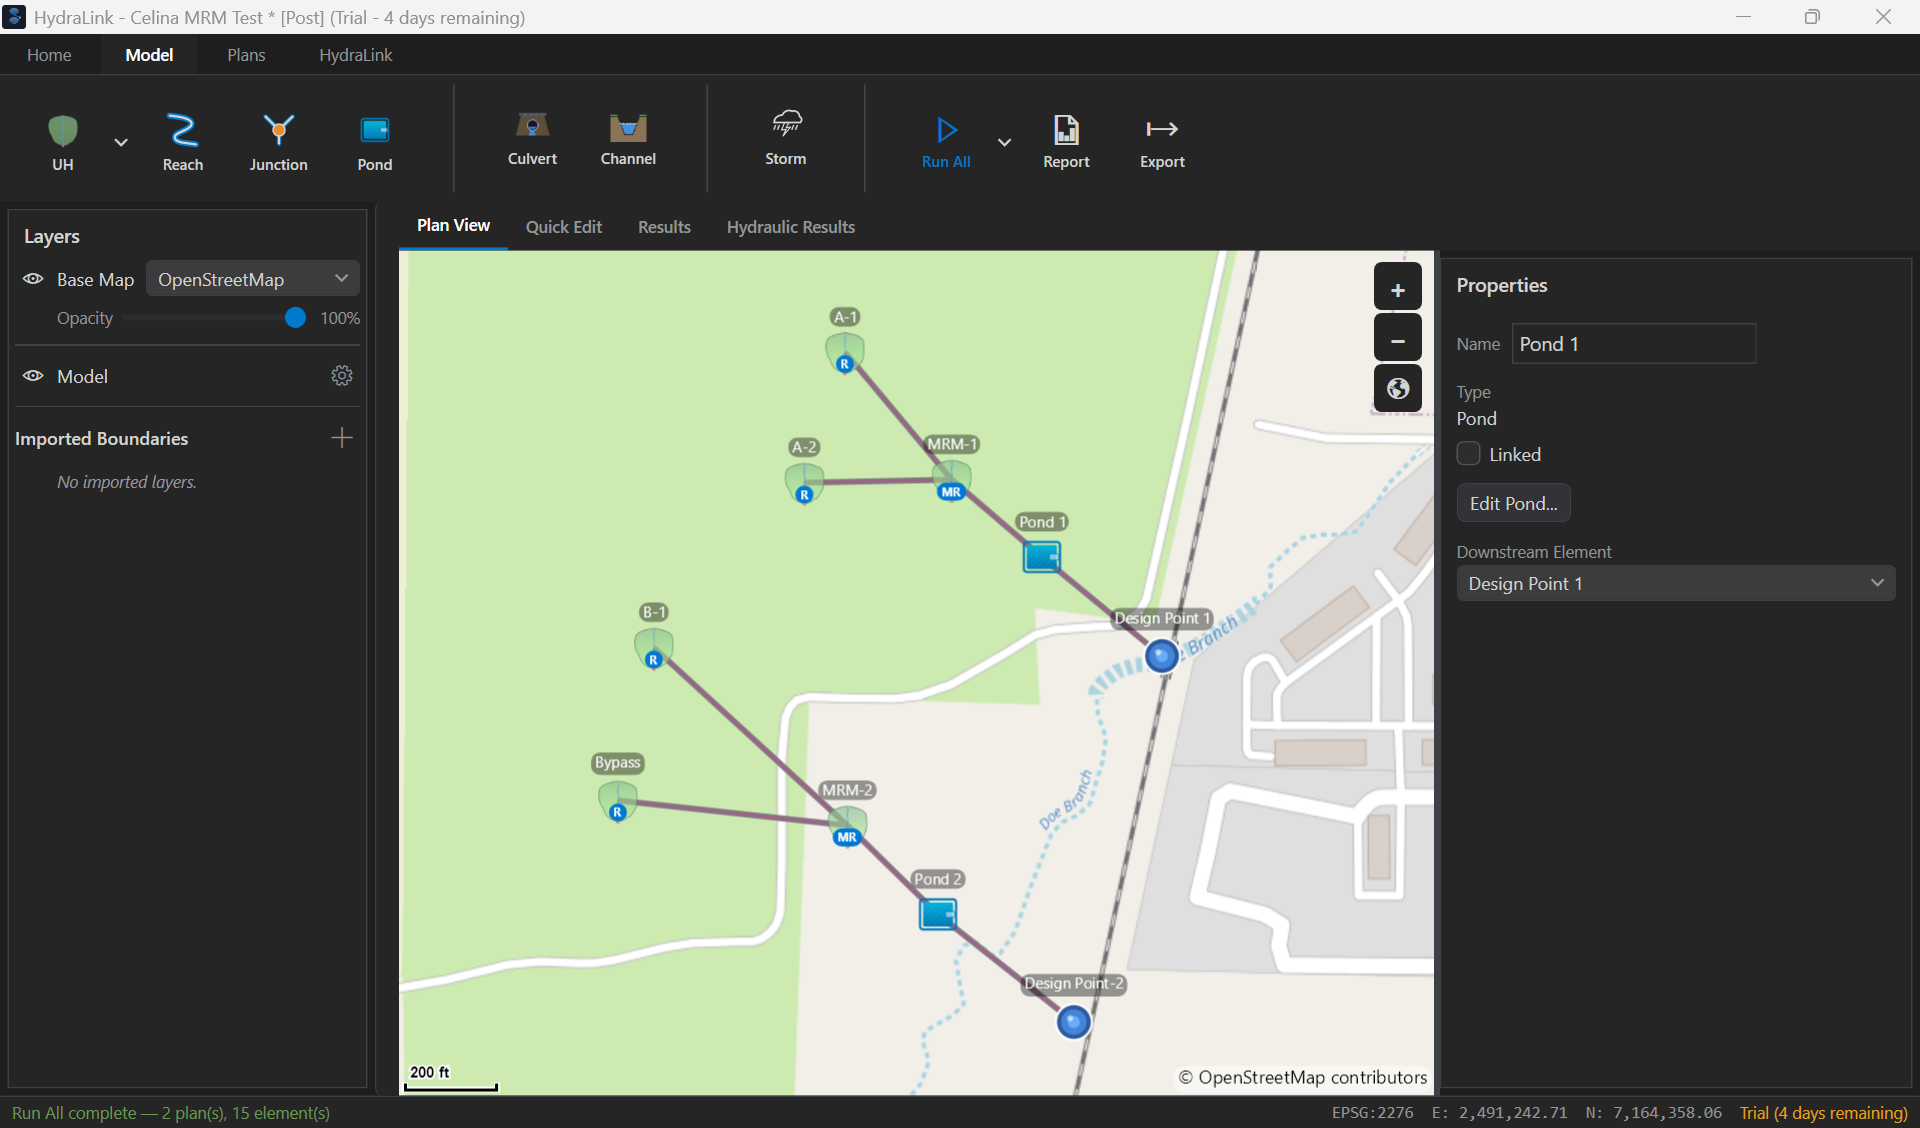
The complete project has two plans:
Pre-Development Plan
Rational Basin 1 (10 ac, C=0.30, Tc=20 min)
  → Junction 1 (linked)
Post-Development Plan
A-1 (6 ac, C=0.70, Tc=10 min) ──┐
                                   ├── Mod. Rational Basin 1 → Pond 1 → Junction 1 (linked)
A-2 (4 ac, C=0.70, Tc=10 min) ──┘
10 Run Again to Finalize
After finalizing the pond design, click Run again. This second run calculates the flows through the pond and propagates the outflow to Junction 1, completing the network analysis. The junction will show the combined discharge from the pond outlet, which should now be at or below the allowable release rate.
11 Compare Plans
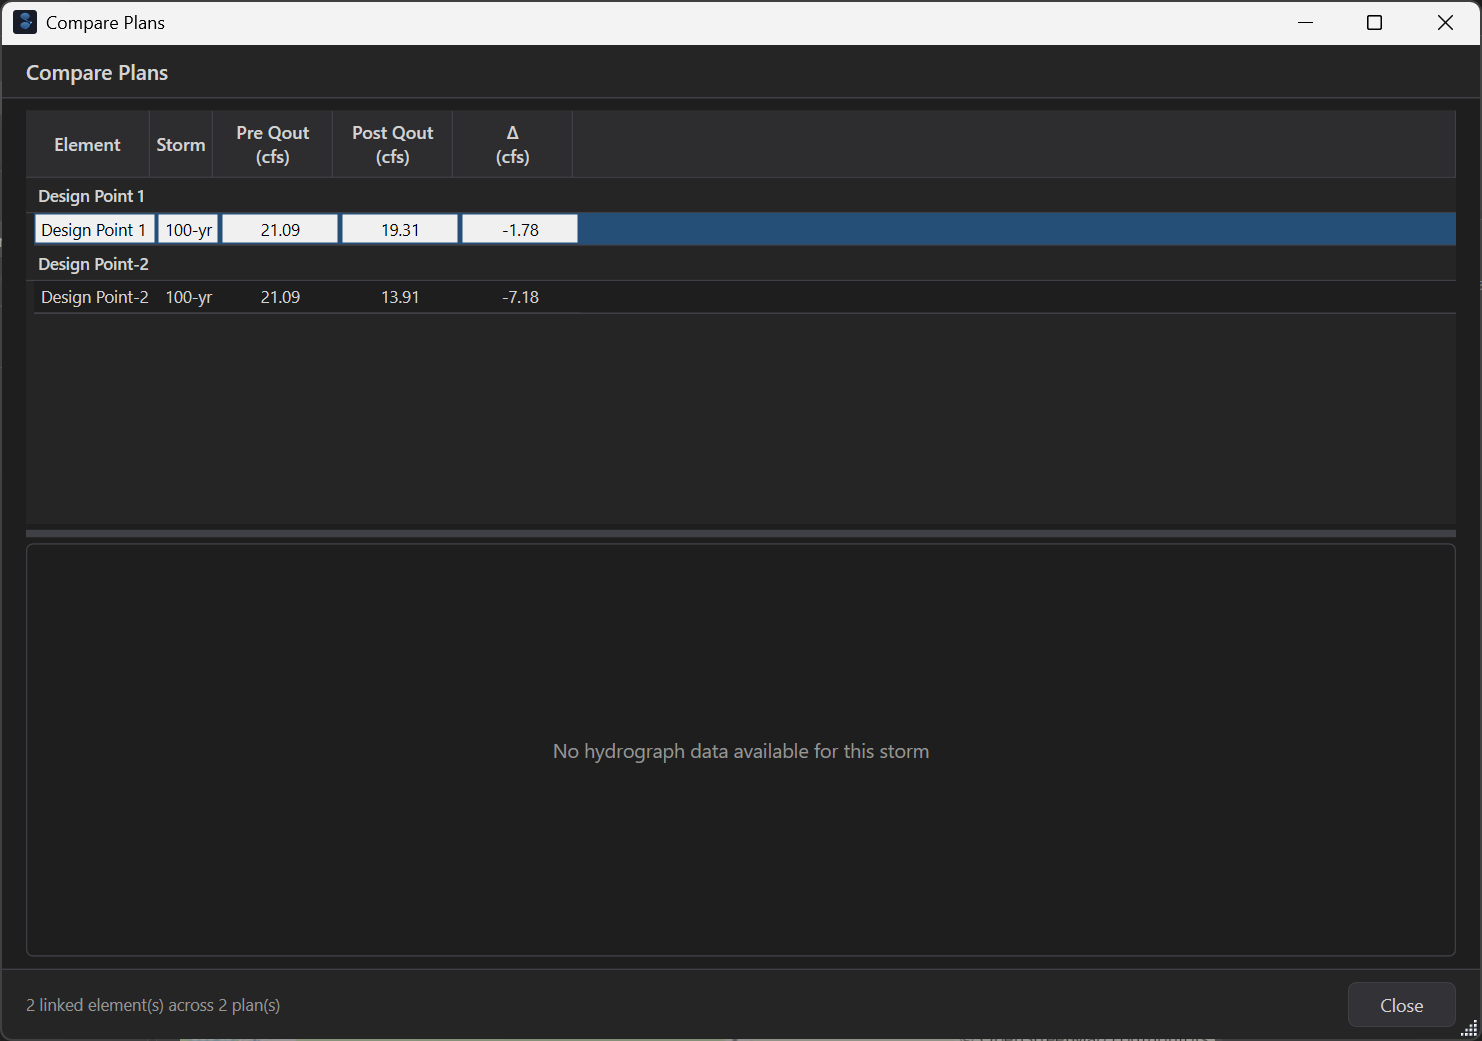
With both plans solved, use Compare on the Plans tab to view a side-by-side summary of linked elements across plans. Because Junction 1 is shared between the Pre and Post plans, the comparison table shows each plan’s outflow for every storm event with the change from the Pre plan (Δ in cfs and Δ%) on the Post row (green = reduction, red = increase). The report’s Linked Junction Comparison prints the same columns.
This provides a quick summary for verifying that the post-development outflow at the downstream junction meets the pre-development allowable release rate for each design storm.
Bypass & Pass-Through Flows
Real-world detention designs often involve flows that either skip the pond entirely or flow through it without being detained. Understanding these concepts is critical for correctly sizing detention and designing the outlet structure.
Pass-Through Flows
Pass-through flows are typically off-site flows that enter and exit the detention pond but are not generated by the development. Common examples include an upstream creek or drainage channel that flows through the pond site.
- Pass-through flows do not change the required detention volume, since the volume calculation is a function of the developed site’s runoff only.
- Pass-through flows do not count against the allowable release rate for the detained portion of the site’s runoff. Since these are existing flows that are not being detained, they simply pass through the facility.
- The outfall structure must be sized to convey both the allowable detained release and the pass-through flow. This means the outfall will be larger than it would be without pass-through flows. For example, if the allowable detained release is 20 cfs and 10 cfs of pass-through flow enters the pond, the outfall must be sized to handle at least 30 cfs total.
Bypass Flows
Bypass flows are flows from the development site that do not enter the detention pond. This may occur when a portion of the site drains to a different outlet or when grading directs some runoff away from the pond.
- Bypass flows reduce the contributing area and therefore reduce the required detention volume (less runoff enters the pond).
- However, bypass flows still discharge from the site. The total site discharge is the sum of the pond outflow plus any bypass flow.
- The pre-development allowable release rate applies to the entire site, so bypass flow reduces the amount of flow the pond is permitted to release.
The Infinite Pond Analogy
The relationship between bypass flow and allowable release can be easier to understand with a thought experiment: imagine a developer builds an infinitely large pond that can hold all of the stormwater discharging to it. In that case, the pond releases no flow at all, and the only discharge from the site is the bypass flow. For the site to meet its allowable release rate, the bypass flow alone must be less than the pre-development peak flow. In other words:
If the bypass flow exceeds the pre-development flow, no amount of detention can bring the total site discharge into compliance. This is an important check when deciding how much of a site can bypass the detention facility.
Summary of Flow Roles
| Flow Type | Enters Pond? | Effect on Volume | Effect on Outlet |
|---|---|---|---|
| Design Area | Yes | Increases required volume | Must be released at or below allowable rate |
| Target | N/A (reference) | Sets the allowable release | Defines maximum outlet discharge |
| Bypass | No | Reduces allowable release, increasing required detention | Reduces available release from pond |
| Pass-Through | Yes (not detained) | No change to required detention | Outfall must be sized larger to convey pass-through flow in addition to the allowable detained release |
12 Bypass Scenario: Increasing Required Detention
This example can be extended with a second MRM scenario that demonstrates the effect of bypass flow on detention sizing. In this scenario, a 1-acre portion of the post-development site drains away from the pond (bypass), while the remaining 9 acres drain to a second detention facility.
Bypass Scenario Configuration
| Basin | Role | Area | C | Tc |
|---|---|---|---|---|
| Pre-Development Reference | Target | 10 ac | 0.30 | 20 min |
| Bypass | Bypass | 1 ac | 0.70 | 10 min |
| B-1 | Design Area | 9 ac | 0.70 | 10 min |
Why Bypass Increases Required Detention
Even though the bypass basin removes 1 acre from the pond’s contributing area (reducing inflow from 66.78 cfs to 60.10 cfs), the bypass flow still discharges from the site. The pre-development allowable release rate applies to the entire site, so the bypass flow must be subtracted from the allowable release, leaving less capacity for the pond outlet.
| Metric | Without Bypass (MRM-1) | With Bypass (MRM-2) | Change |
|---|---|---|---|
| Contributing Area | 10 acres | 9 acres | −1 ac |
| Peak Inflow | 66.78 cfs | 60.10 cfs | −10% |
| Allowable Release | 21.09 cfs | 14.41 cfs | −32% |
| Required Storage | 50,028 ft³ | 53,249 ft³ | +6.4% |
The allowable release dropped from 21.09 cfs to 14.41 cfs, a 32% reduction, because the bypass basin’s peak flow is deducted from the pre-development allowable rate. Although the pond sees less inflow, the much tighter outlet constraint means it must store more water: 53,249 ft³ vs. 50,028 ft³.
This demonstrates the “infinite pond” principle: bypass flow reduces the site’s effective allowable release, and if the bypass alone exceeds the pre-development flow, no amount of detention can bring the site into compliance. Always check that Qbypass < Qpre-development before finalizing a site layout with bypass areas.
When to Consider a Different Approach
The Rational Method and Modified Rational Method consider peak flows only: they do not generate a hydrograph, and timing between sub-basins is not modeled. This makes MRM well-suited for:
- Jurisdictions that accept the Rational Method approach (many Texas municipalities including Celina)
- Relatively simple sites where sub-basin timing is not a significant factor
- Preliminary sizing before detailed design
For more complex situations, a unit hydrograph method with full Modified Puls pond routing may be more appropriate:
- Complex drainage networks where sub-basin timing and flow attenuation through reaches affect the combined peak at the pond
- Multiple outlet structures (orifice + weir + riser combinations) where the stage-discharge relationship varies with pond level
- Jurisdictions requiring hydrograph-based analysis
- Large watersheds where the Rational Method assumption of uniform rainfall over the entire area becomes less valid
HydraLink supports both approaches within the same project. You can use MRM for initial sizing and then create an additional plan with unit hydrograph basins and full pond routing to verify the design. The plan management system makes it straightforward to compare results between methodologies.