Getting Started with HydraLink
This guide walks you through creating your first HydraLink project from start to finish. By the end, you'll have set up storm events, built a simple drainage network, run the solver, and viewed your results.
1 Create a New Project
Begin by creating a new project file to hold all of your drainage elements, storm data, and results.
- Click File → New Project (or press
Ctrl+N). - The map canvas will open ready for you to navigate to your project location and place elements.
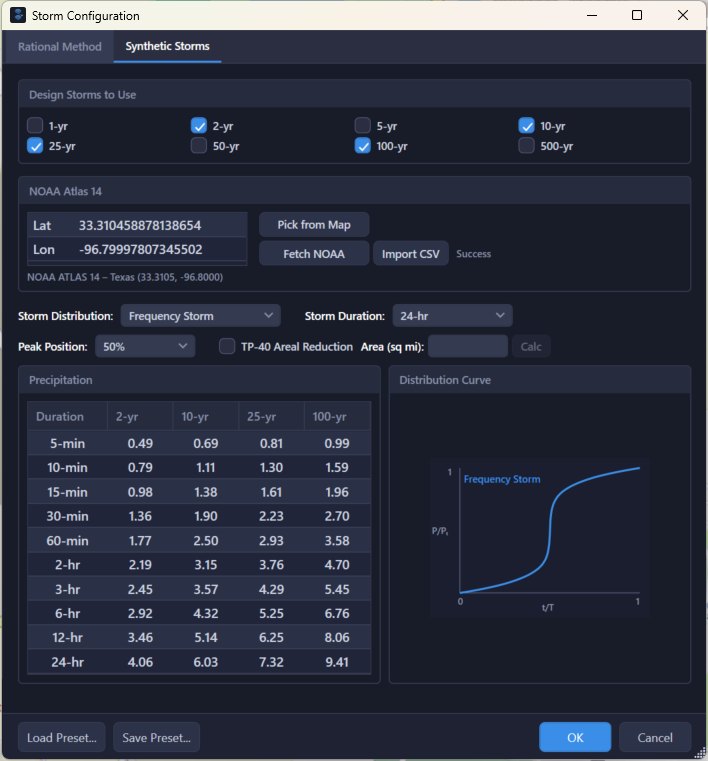
2 Set Up Storm Events
Before running any analysis, you need to define the design storms that HydraLink will use to generate rainfall and compute runoff.
- Open the Storm Events dialog from the ribbon toolbar.
- Add design storms by selecting a return period (e.g., 2-yr, 5-yr, 10-yr, 25-yr, 100-yr).
- Choose an intensity based event to model or a rainfall distribution: SCS Type I, Type IA, Type II, Type III, or a custom distribution.
- Enter the total 24-hour rainfall depth (inches) from NOAA Atlas 14 or local data.
- For NOAA Atlas 14: use the built-in lookup to fetch precipitation frequency estimates, then fit IDF curve coefficients (E, B, D) for use with the Rational Method.
- For the Rational Method: rainfall intensity is resolved from fitted IDF curve coefficients (e, b, d) — either auto-fitted from NOAA Atlas 14 or entered manually from published IDF tables — or direct Atlas 14 intensity interpolation.
- For the Frequency Storm (Unit Hydrograph): the alternating block method constructs a design hyetograph from the depth-duration-frequency data.
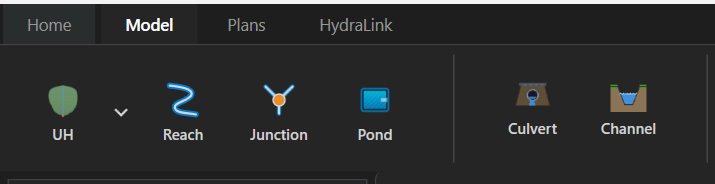
3 Add Elements to the Map
Use the ribbon toolbar to add hydrologic and hydraulic elements to the map canvas. Click an element button, then click on the map to place it.
- Basin — click the Basin button, then click on the map to place a drainage basin.
- Reach — click the Reach button, then click on the map to place a routing reach.
- Junction — click the Junction button, then click on the map to place a confluence point.
- Pond — click the Pond button, then click on the map to place a detention or retention pond.
- Culvert — click the Culvert button, then click on the map to place a culvert crossing.
- Channel — click the Channel button, then click on the map to place an open channel.
Elements appear on the map canvas and can be repositioned by dragging them to the desired location.
4 Connect Elements
Defining the flow connections between elements establishes your drainage network topology.
- Each element has a Downstream property that specifies where its outflow is directed.
- Select an element, then set its downstream element in the properties panel.
- This defines the flow direction and overall network topology.
- HydraLink automatically determines computation order via topological sort, solving upstream elements before downstream ones.
- A valid network must flow from upstream basins to downstream outlets without circular references.
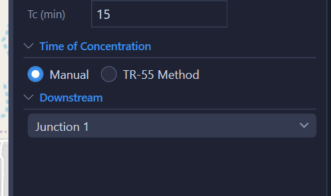
5 Configure Element Properties
Select any element to open its properties panel and enter the required parameters for analysis.
- Basin — set drainage area, methodology (Rational / Modified Rational / Unit Hydrograph), runoff coefficients or curve numbers, and time of concentration.
- Reach — select a routing method and enter channel parameters (length, slope, cross-section).
- Pond — define storage using an elevation-area table and configure outlet structures for pond routing.
- Culvert — specify barrel shape, dimensions, entrance type, and road overtopping parameters.
- Channel — choose a cross-section shape, enter geometry, Manning's n, and slope for capacity analysis.
See the individual element help pages linked above for detailed parameter guidance.
6 Run the Solver
Once your network is defined and all element properties are configured, you are ready to solve.
- Click the Run button in the ribbon toolbar (or press
F5). The Run button is a split-button — click the dropdown arrow to choose Run Active Plan or Run All Plans. - HydraLink validates the network for errors (missing connections, circular references, incomplete parameters).
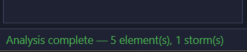
- The solver then processes each element from upstream to downstream, computing runoff, routing flows, and analyzing hydraulics.
- Progress is shown in the status bar at the bottom of the window.
- Any errors or warnings are displayed in the Messages panel.
7 View Results
After solving, click any element to view its computed results in the properties panel and results dialogs.
- Basin — peak flow, time to peak, runoff volume, and the full runoff hydrograph.
- Reach — routed peak flow, attenuation, and a hydrograph comparison (inflow vs. outflow).
- Pond — peak stage, peak outflow, storage used, and stage-storage-discharge curves.
- Culvert — headwater elevation, HW/D ratio, control type (inlet or outlet), capacity, and road overtopping flow.
- Channel — normal depth, velocity, Froude number, flow regime, and channel capacity.
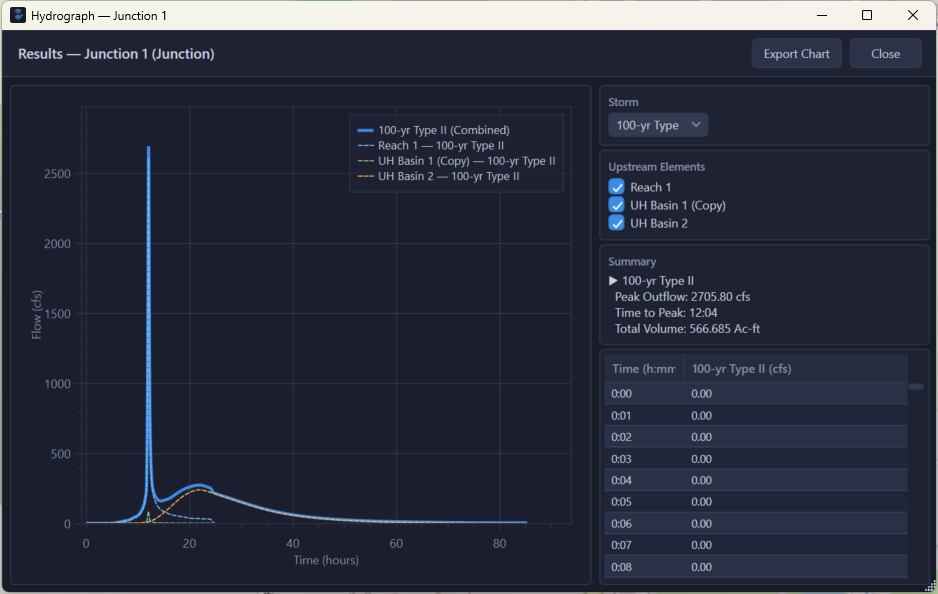
Use the Hydrograph dialog to view and compare hydrographs across multiple elements and storm events on a single plot.
8 Generate Reports
HydraLink can produce comprehensive reports documenting your entire analysis.
- Click the Report button in the ribbon toolbar.
- Choose your output format: PDF, Word (.docx), or Both.
- The report includes:
- Project information and description
- Storm event summary
- Element parameters for each component
- Computed results (peak flows, stages, velocities)
- Hydrograph plots
- Reports can be customized to include specific elements and storms.
Tips for New Users
- Start with simple networks (1 basin → 1 reach → 1 outlet) before building complex systems.
- Save frequently — HydraLink project files (
.hyd) contain all data.