IDF Data
IDF (Intensity-Duration-Frequency) data drives the rainfall intensity calculations used by the Rational Method. HydraStorm supports multiple data sources and fits all IDF data to a standard three-parameter equation for interpolation.
IDF Equation
Where:
- i = rainfall intensity (in/hr)
- Tc = time of concentration (minutes)
- b = numerator coefficient
- d = time shift (minutes)
- e = exponent (dimensionless)
The b, d, e coefficients are specific to the project location and return period. This is the same three-parameter form used by TxDOT and most published drainage criteria manuals, and the same one HydraLink uses.
Data Sources
1. NOAA Atlas 14 Fetch
The fastest way to get IDF data for any location in the United States.
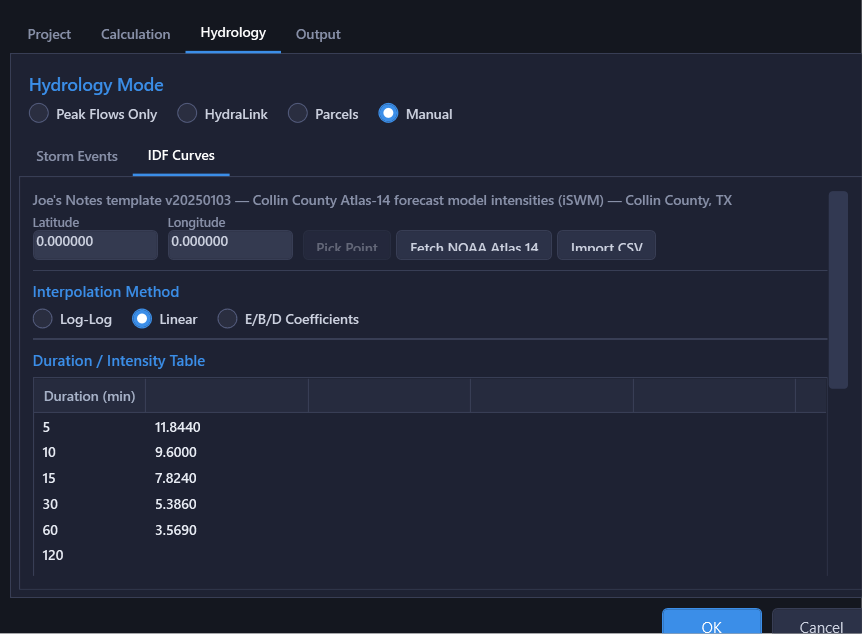
- Enter latitude and longitude for your project site, or use Pick Point to click a location on the Civil 3D drawing.
- Click Fetch NOAA Atlas 14.
- HydraStorm downloads precipitation frequency data from the NOAA servers.
- The curve fitting algorithm automatically fits the b, d, e coefficients.
- An R-squared value is displayed to indicate fit quality.
2. CSV Import
If you have already downloaded IDF data tables from the NOAA Atlas 14 website:
- Click the Import CSV button.
- Browse to the downloaded NOAA CSV file.
- HydraStorm parses the NOAA CSV format and fits the b, d, e coefficients automatically.
3. HydraLink Import
When using HydraLink mode, IDF coefficients can be imported directly from the HydraLink project file. HydraLink supports both:
- Pre-fitted coefficients: b, d, e values already computed by HydraLink.
- Raw Atlas 14 tables: intensity-duration data that HydraStorm fits using the same algorithm.
4. Manual Entry
Many drainage criteria manuals publish a table of intensity against duration rather than equation coefficients, and require you to use it. Type it in directly:
- On the Hydrology tab, declare each return period the manual covers in the Storm Events table. Every storm you add gets its own intensity column.
- On the IDF Curves sub-tab, fill in the Duration / Intensity Table. The standard durations are already there; Add duration covers any others the manual publishes (20, 25, 40, 45, 90 min …), up to 180 min. Leave a cell blank to omit that duration for that storm.
- Pick the Interpolation Method the manual implies: Log-Log or Linear to read between the published rows, or b/d/e Coefficients plus Generate from Table to fit a smooth curve through them.
You can also enter the b, d, and e coefficients directly, without a table, when the manual publishes its own IDF parameters, one row per storm in the coefficient grid.
Interpolation Method
All IDF data lives in the Project Settings > Hydrology > IDF Curves sub-tab: an editable duration/intensity table with one column per storm, the interpolation method radio buttons, the per-storm equation coefficients with a Generate from Table button, and a log-log IDF chart. Choose how HydraStorm looks up intensity for a given Tc:
- Log-Log: interpolate the intensity table using log-log interpolation between points. The standard choice for Atlas 14 table data, and the default for any project with table data.
- Linear: interpolate the intensity table linearly between points.
- b/d/e Coefficients: use the fitted equation
i = b / (Tc + d)einstead of interpolating the table.
In the two table-based modes (Log-Log, Linear), HydraStorm always reads from the intensity table, even if fitted coefficients also exist alongside it. In Coefficients mode, a storm with no coefficients still reads from the table.
Cover your longest Tc
Intensity should keep falling as Tc grows, but a table has no data past its last row. When a node's Tc is shorter than the first duration your IDF data covers, or longer than the last duration in the table, HydraStorm raises a calculation warning naming the affected nodes. The long end matters most: a Tc past the end of the table is priced as if it were the longest tabulated duration, which over-states intensity and over-sizes everything downstream. Extend your table past the longest Tc your project reaches, or switch to Coefficients mode, where the equation keeps falling at long durations.
About the Curve Fit
Two things about the fit are worth knowing:
- It matches HydraLink. HydraStorm fits b, d, and e the same way HydraLink does, so the same rainfall data produces the same coefficients in both programs, and your HydraStorm intensities will agree with the HydraLink runoff they came from.
- It favors short durations. The rational method is a short-duration method, so the fit concentrates on the durations storm drain design actually uses rather than long-duration rows.
The R-squared value shown after fitting tells you how well the equation reproduces your data: values above about 0.99 are typical for Atlas 14 data. A noticeably lower value usually means the source table spans an unusually wide duration range or contains a bad row.
One Curve Per Storm
Each storm on the project's Storm Events list carries its own intensity column and its own b, d, e row, for design, check, and any additional analysis storms alike. Generate from Table fits every storm that has at least three durations, and names any it could not. For example:
| Storm | Return Period | b | d | e | Fit (R²) |
|---|---|---|---|---|---|
| Design | 10-year | 96.3 | 13.8 | 0.874 | 0.996 |
| Check | 100-year | 142.7 | 14.2 | 0.851 | 0.994 |
The grid's Fit (R²) column reads “—” for a row whose b/d/e were typed by hand rather than fitted; there's no residual to report against a table that was never used. Each storm event uses its own IDF curve for intensity interpolation.
Verifying the Fit
After fitting or entering IDF coefficients, verify the results by checking:
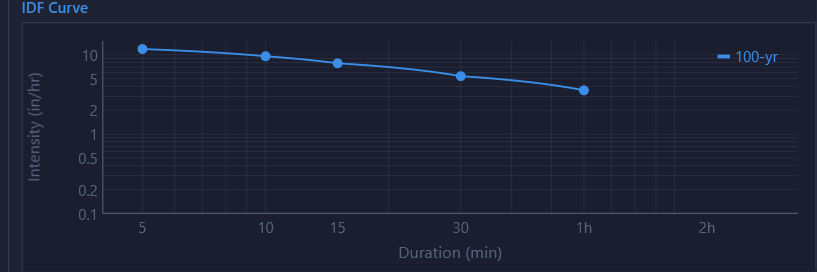
- R-squared: values above 0.99 indicate an excellent fit. Values below 0.95 may warrant investigation.
- Spot-check intensities: compare the fitted curve output at common durations (5, 10, 15, 30, 60 min) against published values for your location.
- Reasonableness: intensity should decrease as duration increases. Typical 10-year, 5-minute intensities in the U.S. range from about 4 to 10 in/hr depending on location.
Note: The IDF Curves sub-tab shows in every hydrology mode except Peak Flows Only, where flows are provided directly and no intensity lookup happens at all. In HydraLink mode the whole editing surface (table, coefficients, interpolation method, lat/lon, and every fetch/import/generate command) is read-only with a lock note, because the linked file is authoritative for this data, including which interpolation method it implies and how its coefficients are read. Switch to Manual to edit it directly.
Note: A rational hydrology mode needs a usable intensity source for every configured storm return period, not just design and check. See IDF Curve on the Rational Method page for what happens (an OK-gate block in Project Settings, and a calculation error if the data goes missing later) when one isn't.