Profile View
The profile view is a custom-drawn canvas occupying the left portion of each tab's profile row in the main window, next to the inline property panel. It renders the pipe network in profile along each alignment as a drafting-sheet exhibit, providing immediate visual feedback as you edit pipe geometry and run hydraulic calculations.
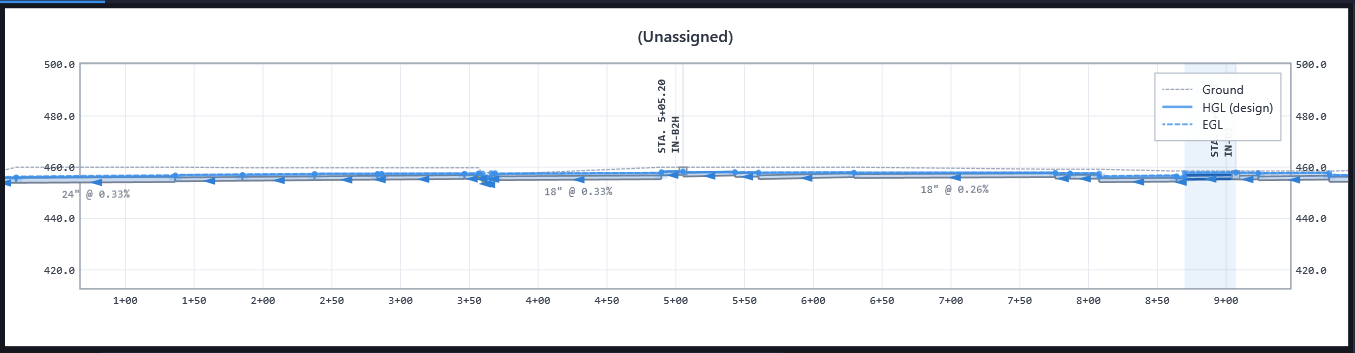
Canvas Theme
From View > View Settings..., choose a canvas theme for the storm drain and culvert profiles:
- Drafting Sheet (default): Renders the profile as a white, plotted-drawing-style exhibit, with a title block above the frame and elevation axes labeled on both sides like a plotted profile sheet.
- Dark: Keeps the dark instrument-panel canvas for on-screen work.
View Settings also configures, per storm and per overlay (HGL/EGL/Ground), the line color, width, and style, plus a legend overlay listing the line style for each visible overlay, and whether crossings and incoming pipes are drawn. The legend stands in whichever inside corner of the frame covers the least of the drawing, keeping clear of the run's two ends and of the pipes that tie into it before anything else, so it can sit in a different corner from one run to the next instead of over the high end of the profile. To keep it in one place, pick a corner under LEGEND > Position; the default is Auto.
What's Displayed
The base profile view always shows the following elements:
- Pipe segments: Drawn as rectangular outlines between structures, showing the pipe barrel with inner diameter (or box dimensions).
- Structures: Object-rendered rather than simple verticals. Manholes draw as a barrel + cone + rim, inlets as a hollow box under the rim, matching the plan-sheet convention for each structure type. A rotated label alongside each structure shows its station and part name, plotted-sheet style, collapsing to a single compact line when space is tight; rim, invert, and HGL values are read from the results grid or the hover readout.
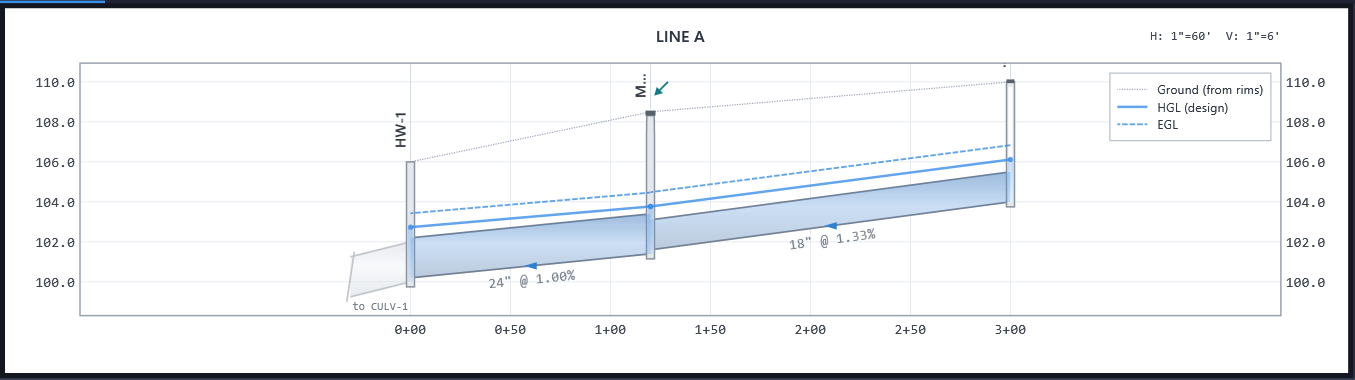
- Pipe callouts: Always-on labels under each barrel showing size and slope (e.g. "24" @ 0.26%"), the way a plotted profile sheet labels its pipes.
- Lateral continuation stubs: Where a lateral pipe discharges into a trunk shown in a different profile, a ghost of the receiving trunk pipe is drawn past the lateral's downstream end for continuity context.
Display Overlays
The toolbar (and, on the Culvert tab, a compact per-tab View ▾ button) provides toggle buttons to show or hide additional data overlays on the profile. Each overlay can be turned on or off independently. The Inlet tab has no profile canvas or View menu of its own. See Inlet Analysis for its section/structure diagrams.
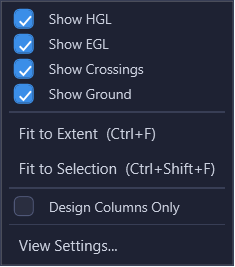
HGL (Hydraulic Grade Line)
The HGL overlay plots the computed water surface elevation at each pipe as a continuous line across the profile. Line color, width, and style are configurable per storm in View Settings; the design storm defaults to a solid blue (#3B8EE8) and the check storm to a lighter, dashed blue (#90CAF9). These are defaults, not fixed conventions, and can be changed. This is the single most important overlay for storm drain design: it shows whether pipes are flowing under pressure (surcharged) or at partial depth. When the HGL rises above a pipe crown, the pipe segment is highlighted to indicate surcharge. When it rises above a structure rim, a critical overtopping warning is flagged. Every computed storm draws its own HGL line at once (design, check, and any analysis storms), so the profile isn't limited to one storm at a time the way the results grid is. Each line takes the color, width and style set for its storm in View Settings, and unchecking a storm's Show box there removes that line (and its legend row) without touching the others; analysis storms with no style of their own fall back to an automatic palette. When enabled, a water-surface fill shades the water prism inside pipes and structures for the design storm, so surcharged runs and partial-flow spans read at a glance. A small ∇ tailwater marker is drawn only at true free discharges (an Outfall node or a dangling pipe end with no structure), not at a lateral's connection into a trunk, since that connection is downstream-only within the lateral's own profile rather than a true tailwater condition.
A run with no design flow entered anywhere is left dry rather than plotted as a false zero-flow HGL: a NO FLOW banner appears in the top-left of the frame instead. On an otherwise-flowing network, an individual dry pipe still shows its structure's standing water as a dotted pool at the downstream-most wet elevation, so a lateral with no flow assigned doesn't read as simply missing from the drawing. Where the water surface passes through a hydraulic jump, a short HYD JUMP leader labels the rise so it reads as a located hydraulic feature rather than a plotting glitch.
EGL (Energy Grade Line)
The EGL overlay is plotted as a dashed line above the HGL. It represents total energy (water surface plus velocity head, V²/2g). The vertical gap between HGL and EGL equals the velocity head in each pipe. At junctions, the EGL step represents the junction energy loss (hj).
Ground
When enabled, the ground surface profile is drawn along the alignment. This is useful for visually checking pipe cover, the vertical distance between the ground line and the pipe crown. Insufficient cover is a common design issue flagged in the results table.
Choosing the surface(s). From View > View Settings... > Storm Drain tab, under SURFACES, pick which Civil 3D surface in the drawing draws as the ground line, by name. A second surface (typically finished grade shown alongside existing ground) can be added below it, with its own Show checkbox, color, width, and line style (defaulting to purple), independent of the first: hiding one never hides the other. Which surfaces are picked is saved with the project, since a surface name is a fact about the drawing; the color, width, and style you choose for each are a per-user preference that carries across projects. This is separate from the Surface 1 / Surface 2 picks in Create Profile Views. Changing what you look at on screen never changes what gets drafted into Civil 3D. If a project has never picked a surface, the ground line resolves the way it always did (the pipe network's reference surface, else the drawing's first surface), so nothing changes on older projects.
How the line is drawn depends on where the elevations came from, and the legend names the surface in use so you can tell at a glance:
- The configured style: the line is that surface's, whether the alignment already carries a profile from it (HydraStorm draws exactly what Civil 3D has) or HydraStorm sampled the surface directly to build the line. The legend says (sampled) in the second case.
- Dotted: no surface is available at all; the ground line interpolates between structure rims. This style is fixed so a line that is not a ground line can never be dressed as one.
Crossings (Storm Drain tab only)
The crossings overlay draws every location where a pipe from another network (another storm line, or a water/sewer utility referenced through a data shortcut) crosses the current alignment. Each crossing pipe appears as a true cross-section (circle or box) at its real elevation and width, stretched by the vertical exaggeration exactly as on a plotted sheet, labeled with the pipe name and the measured vertical clearance. Crossings closer than the project's Min Crossing Clearance (Project Settings > Storm Drain, default 1.0 ft) are drawn in a heavier red.
A red dashed keep-out ring around each crossing section shows the required clearance zone: if your pipe barrel enters the ring, the crossing is in violation. Clearance values and violation flags update live as you edit inverts in the grid or property panel, so you can watch a conflict clear as you lower a run. Auto Design uses the same clearance to grade proposed pipes around crossings automatically.
When crossings are read from the drawing. The crossing utilities live outside the network you are designing (often in another drawing entirely, reached by a data shortcut), so HydraStorm captures them by scanning the drawing rather than tracking them live. The scan runs when a network is first imported, when a project is opened, and whenever you draft profile views or the crossing schedule. Clearances and violation flags update live against your pipes as you edit; the crossing utility itself is a snapshot. If a data shortcut has been synchronized, or a utility was moved, resized, added, or deleted while HydraStorm was open, run View > Rescan Crossings to re-read them. The status bar reports what changed, including “unchanged”, so you can confirm nothing moved. If a referenced network cannot be read (an unresolved shortcut), crossings already found against it are kept and named in the status bar rather than dropped.
Incoming Pipes (Storm Drain tab only)
Where a lateral ties into the run you are viewing (or, on a lateral's own profile, where the trunk arrives at the junction), the pipe coming in is drawn as a cross-section at that structure, the same way a crossing is: a circle or box at its true size, stretched by the vertical exaggeration, in a dashed teal so it is never mistaken for a foreign utility. The section sits at the incoming pipe's own invert, not the structure's, and the run it comes from is named in a rotated label beside the structure name, to the right of the station line and on the same side of the structure: the name only, so the labels stack cleanly where several runs meet; the section itself shows the size and invert against the trunk. That placement is the point: a lateral that comes in below the trunk invert, or hangs well above it, shows against the trunk barrel at a glance, without opening the grid. Pipes leaving a structure are not drawn here; the trunk continuing past a lateral's junction is the continuation stub described above.
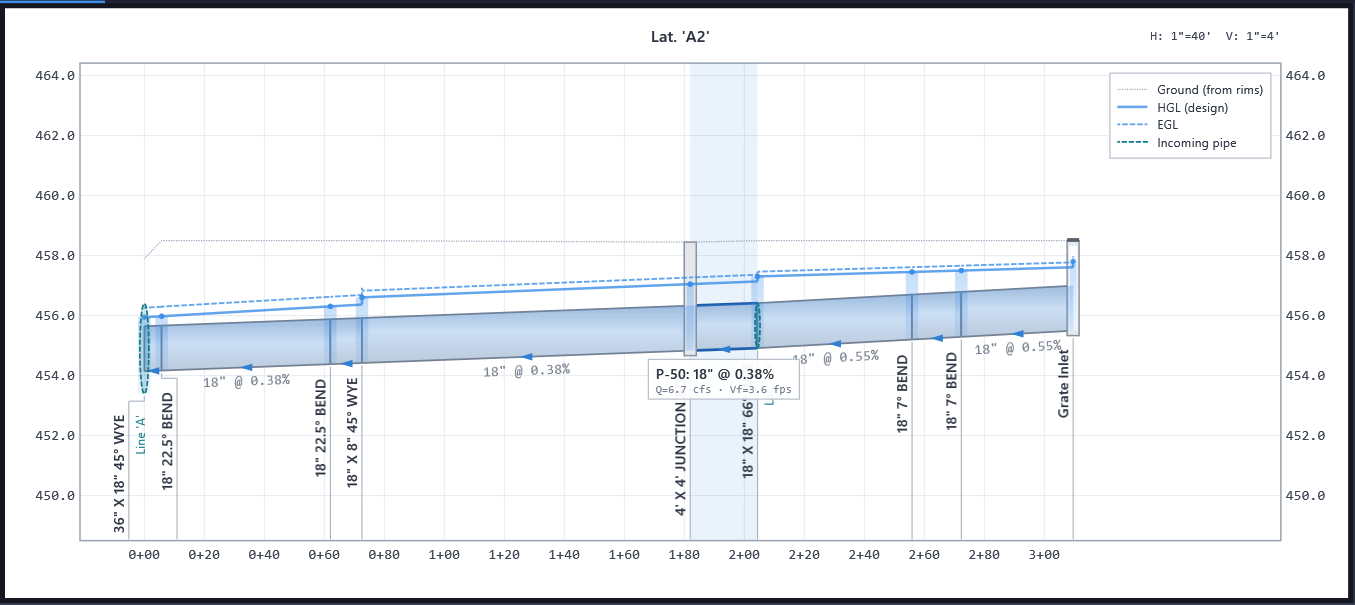
Toggle it with Show Incoming Pipes on the View menu (beside Show Crossings) or under INCOMING PIPES in View Settings; the legend gains an Incoming pipe row whenever any are on screen. The setting is per user, like the other overlay toggles.
Navigation
| Action | Control |
|---|---|
| Select a pipe | Click it; Ctrl+click toggles it in/out of the selection; Shift+click selects the flow path between it and the anchor pipe; see Selection below |
| Select multiple pipes | Click and drag a rectangle across them; hold Shift or Ctrl while dragging to add the rectangle's pipes to the existing selection instead of replacing it |
| Walk the run | Left / Right arrow keys |
| Fit to extents | Ctrl+F, View menu → Fit to Extent, or double-click anywhere while zoomed in |
| Fit to selection | Ctrl+Shift+F, View menu → Fit to Selection, or double-click a pipe. See Fit to Selection below. |
| Pan the profile window (long runs only) | Drag the scrollbar under the canvas; small step 25 ft, large step (click the track) one full window. See Long Runs & the Profile Window below. |
The profile view is deliberately fit-based rather than free-zoom: there is no mouse-wheel zoom or drag-to-pan on the canvas itself. Fit to Extent frames the whole alignment run with comfortable margins (or, on a run longer than the configured window, the current station window; see below); Fit to Selection frames the pipes you're working on. The one exception is the long-run scrollbar: it pans the station window at a fixed scale, which is a pan, not a zoom, and the scale readout in the title band doesn't change while you drag it. This keeps the view predictable while you edit: it never ends up scrolled somewhere unexpected.
Long Runs & the Profile Window
Compressing a very long pipe run onto one screen eventually makes pipe callouts and structure data blocks unreadable, no matter how aggressively they decimate. Rather than let that happen, HydraStorm caps how much station length the storm drain profile will fit at once: when a run exceeds the configured limit, Fit to Extent shows a scrollable station window of that length instead of compressing the entire run. Runs shorter than the limit are unaffected and render exactly as before.
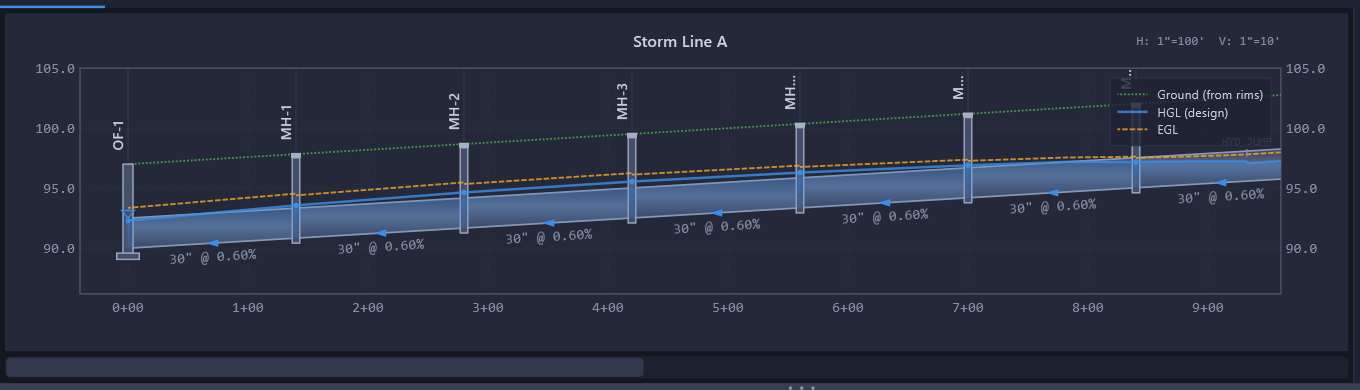
A horizontal scrollbar appears under the profile canvas only when the current run is being windowed. Dragging it pans the window at a fixed scale: it never zooms in or out, so pipe and structure geometry stay at the same visual size while you scroll along the run.
Configuring the Window Length
Set the window length from View > View Settings... > Storm Drain tab, under LONG RUNS:
- Limit profile window to [ ] ft: checked by default. Uncheck it to restore the old behavior of always fitting the entire run to the canvas, however long it is.
- The length field defaults to 800 ft and accepts a minimum of 100 ft.
This is a per-user setting, like the rest of View Settings, and it applies only to the storm drain profile; the Culvert and Inlet tab profiles always fit their full extent.
How the Window Follows You
- Selecting a pipe (grid row click or profile click) outside the current window slides the window the minimum distance needed to bring it into view. Selecting a pipe that's already visible never moves the view.
- Fit to Selection and its sticky behavior take priority over windowing and work exactly as described below; the scrollbar hides while zoomed to a selection, since there's nothing to pan. Fit to Extent returns to the windowed view, positioned near wherever you last had a pipe selected rather than snapping back to the start of the run.
- The window's position is preserved across edits and recalculations; it doesn't reset to the start of the run every time you change an invert or slope.
- Vertical fit follows the contents of the current window rather than the whole run, so scrolling along a sloping run keeps the visible pipes, HGL/EGL, and ground framed as you go.
Selection
Click on a pipe segment in the profile to select it. The selected pipe's invert/crown outline strokes in accent blue in addition to the existing selection highlight band, and its properties appear in the property panel on the right side of the window. The corresponding row in the results table is also highlighted. Deselecting removes the highlight.
A pipe flagged missing-flow (amber) or invalid (red) keeps its validation color even when selected: a validation warning is never masked by clicking the pipe.
Use the Left and Right arrow keys to move the selection to the previous or next pipe in the network. This allows you to quickly walk through a pipe run without clicking each segment individually.
Tip: Keyboard Navigation
- Use arrow keys to step through pipes sequentially along an alignment.
- At a confluence (Y-junction), the arrow keys follow the main trunk by default.
- Click directly on a branch pipe to switch to that branch.
Multi-Select
Ctrl-click a pipe to add it to (or remove it from) the current selection without disturbing the rest. Drag a rectangle across several pipes to select everything it touches; hold Shift or Ctrl while dragging to add the rectangle's pipes to the existing selection instead of replacing it.
Shift-Click Span Select
Click a pipe to set it as the anchor, then Shift-click another pipe: every pipe on the flow path between the two, inclusive, is selected, the same way Shift-click fills a range of cells in a spreadsheet.
The span follows flow, not station order, so it works across a confluence: anchoring on a lateral and Shift-clicking a trunk pipe below the junction selects the lateral plus the trunk pipes down to the click, not the trunk pipes above the junction, since those aren't on that flow path.
If the two pipes don't sit on a single flow path (two separate branches that merge somewhere downstream, for example), there's no span to fill. The clicked pipe is simply added to the selection instead, and the status bar explains why.
A multi-pipe selection built this way also becomes the scope Auto Design offers when you want to size just a few pipes instead of the whole alignment.
Selected-Pipe Callout
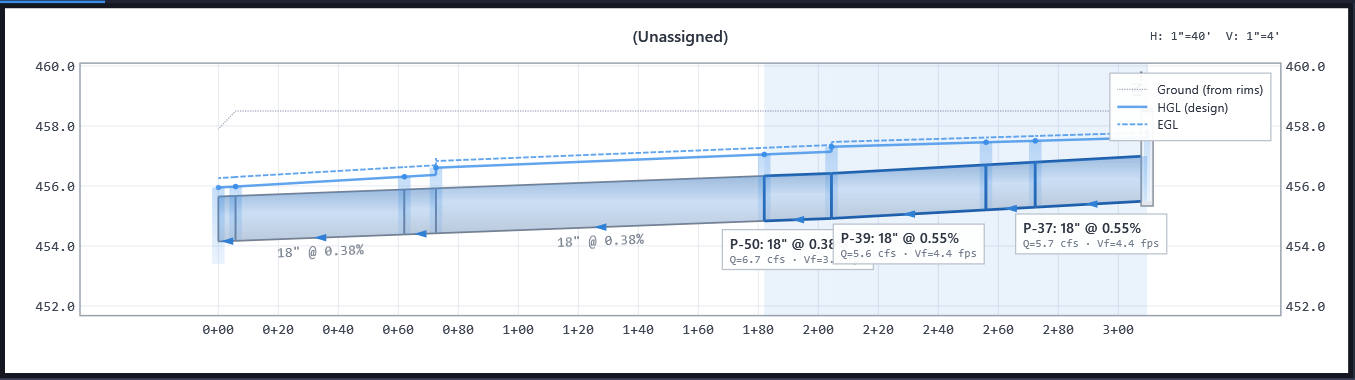
Selecting a pipe shows an info chip hanging below the barrel midpoint, clear of the ground line and the structure labels above it, giving you the pipe's key data without opening the property panel:
- First line: name, size, and slope, e.g.
P-102: 24" @ 0.85%. Box culverts and other non-circular conduits show width × rise in feet, e.g.P-102: 3.0'x2.0' @ 0.85%. - Second line:
L=245' · Q=12.4 cfs · Vf=6.2 fps. Length is always shown; total flow (Q) and full-flow velocity (Vf) appear once calculation results exist.
Chips are only drawn for selected pipes, and are skipped on pipes plotted narrower than about 50 pixels; this keeps a wide multi-pipe selection readable instead of stacking unreadable chips on top of each other. Zooming in (or using Fit to Selection) widens the pipe enough for its chip to appear. Deselecting the pipe removes its chip.
Engineering Scale & Vertical Exaggeration
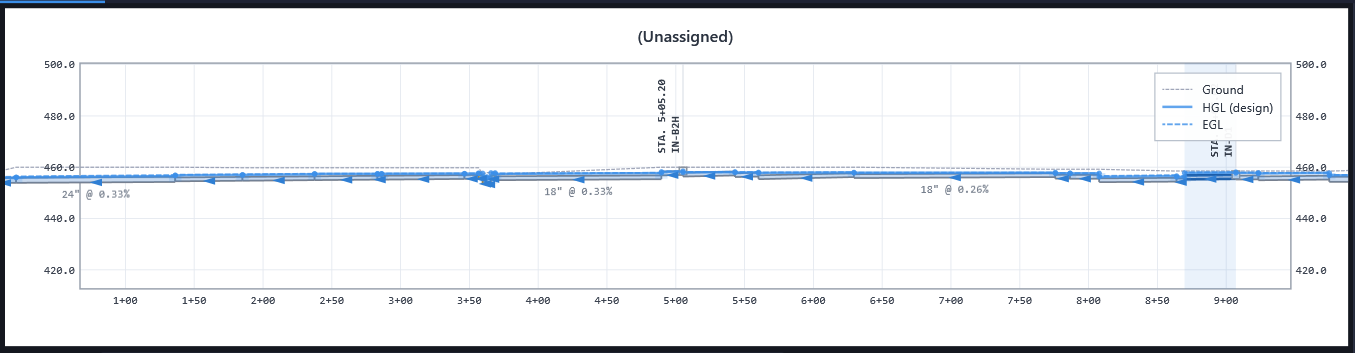
The profile always renders at a true engineering scale pair with a fixed 1:10 vertical exaggeration, the way a plotted profile sheet does. Every fit (Fit to Extent, Fit to Selection, and the long-run window) picks the smallest standard scale that shows everything in view, both the full station length and the full elevation range including HGL/EGL and ground:
- 1"=40' H / 1"=4' V: the default and finest scale
- 1"=50' / 1"=5', then 1"=60' / 1"=6', then 1"=100' / 1"=10'
- Above 100, the horizontal scale steps in 10 ft increments (1"=110', 1"=120', …), with the vertical scale always one tenth of it.
Because the exaggeration is fixed, a steep run steps up to a coarser scale instead of being silently flattened: grades plot at a true 10× slope at every scale, so a steep lateral actually looks steep. The content is centered in the frame; a short run at 1"=40' occupies its true scaled length rather than stretching to fill the canvas. Resizing the window or the profile pane re-fits and can move the view to a different scale on the ladder.
The right side of the title band shows the current pair, e.g. H: 1"=100' V: 1"=10'. It is computed from what is actually drawn, so it always states the true rendered scale. Scale inches are nominal screen inches; the ratios and the 1:10 exaggeration are exact regardless of monitor size or display scaling.
Structure Labels
Structure labels are rotated to read alongside the structure. Each one hangs below the structure when the name fits between the structure and the bottom of the frame, and sits above the rim otherwise: the room above a rim is only the fit's padding wherever the ground is the highest thing on the sheet, typically the upstream end, and a label there would trim to nothing. A label below reads upward toward the structure and never sits over a barrel, an incoming-pipe section or a crossing at that station; the names of incoming runs go on the same side. Where neither side has room the label takes the roomier one and trims with an ellipsis instead of clipping mid-character.
Fit to Selection
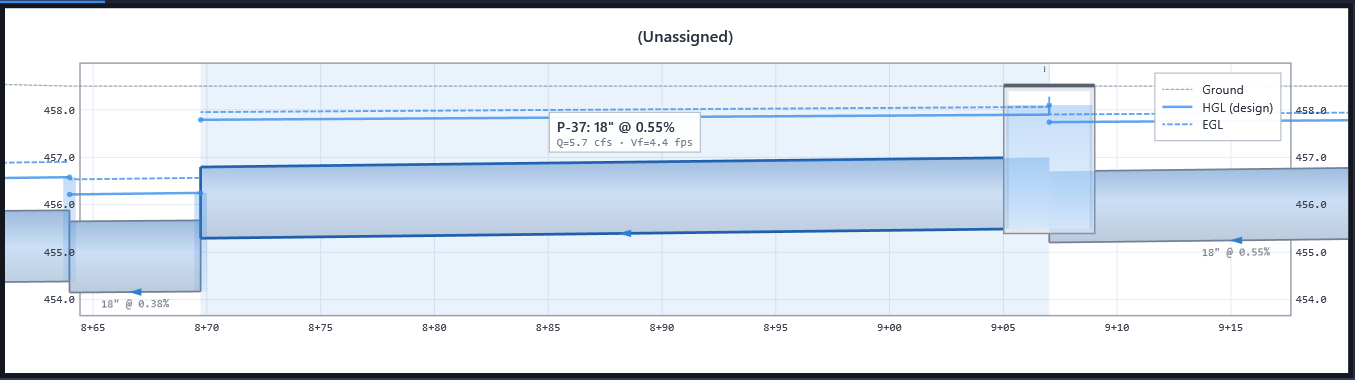
Fit to Selection zooms the profile to the selected pipe(s) plus half of each adjacent pipe, so you always keep a bit of upstream/downstream context instead of framing the selection edge-to-edge. The elevation range always includes the HGL/EGL for every displayed storm, structure rims, and ground surface within the zoomed window. Like every fit, the zoomed view lands on a standard engineering scale at a true 1:10 exaggeration, typically the 1"=40' floor for a short selection.
Three ways to invoke it:
Ctrl+Shift+F- View menu → Fit to Selection
- Double-click a pipe: selects the pipe and zooms to it in one action, from the full-profile view. Double-click also works on the Culvert tab's profile.
While zoomed to a selection:
- The Left and Right arrow keys walk the run as usual, and the view follows each pipe as you step to it, so you don't need to re-fit after every step.
- Edits and recalculations keep the zoomed view instead of snapping back out to the full profile.
- Double-click anywhere to zoom back out. Double-click is a toggle: once you are zoomed in, any double-click returns you to the full profile, whether it lands on a pipe, on a different pipe, or on empty space. You never have to find a barrel to get back out.
Ctrl+F and View menu → Fit to Extent do the same thing: returning to the full profile, or, on a run longer than the long-run window limit, to the windowed view positioned near your last selection.
Live Updates
The profile redraws as you work. When you edit pipe inverts, sizes, slopes, or other properties in the property panel, the following happens automatically:
- The profile redraws immediately to show the new geometry.
- A moment after you stop typing, the full hydraulic calculation runs in the background, so the window stays responsive while you keep editing.
- The HGL and EGL overlays and the results grid update with the new results.
This means you get instant visual feedback on geometry changes and near-instant feedback on hydraulic results. You never need to manually press Calculate to see the effect of your edits, though F5 is available if you want to force an immediate recalculation.
Note: The profile view shows one alignment at a time. Use the alignment grouping in the results table or the network selector to switch between alignments in the network.