Results Table
The results table is the grid at the bottom of the main window. It shows the complete hydraulic calculation output for every pipe segment in the network, organized by alignment. After each calculation cycle, the table updates automatically to reflect current results.
Columns
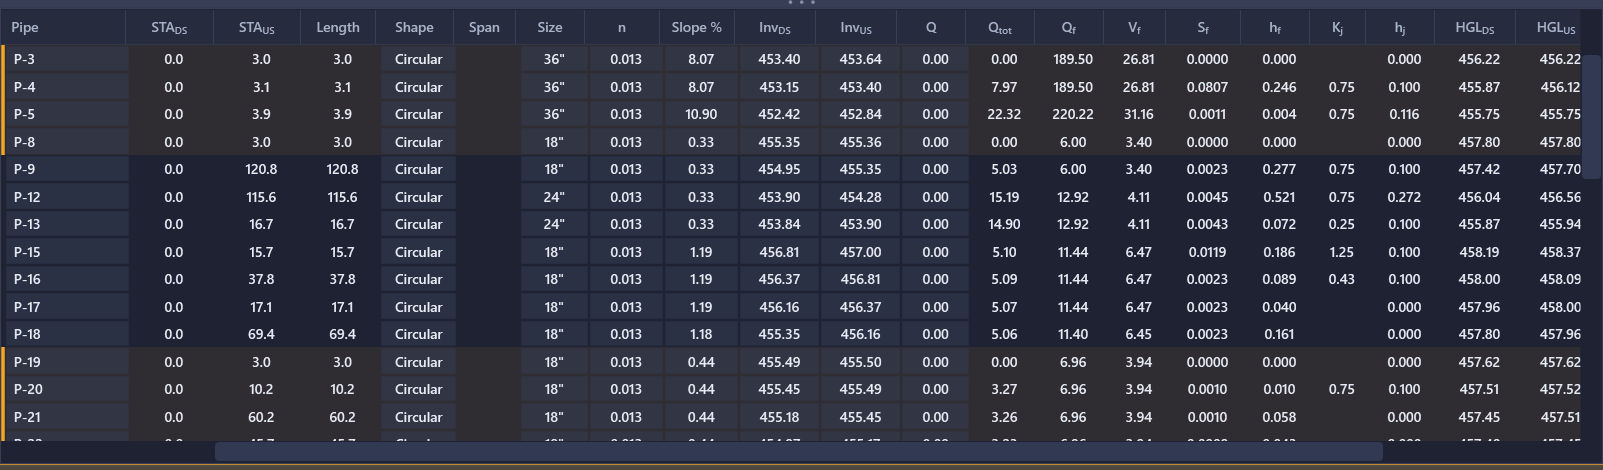
The results table contains the following columns, left to right. All elevations are in feet, flows in cubic feet per second (cfs), velocities in feet per second (ft/s), and slopes as noted per column.
| Column | Description |
|---|---|
| Pipe | Pipe segment name. Editable, but must be unique. |
| STA_DS | Station at the downstream end of the pipe, in plan-and-profile "+" notation (e.g. 12+34.56), which is Civil 3D's projected alignment station where the run carries one, otherwise measured from the run's downstream end. Read-only. The digits after the plus follow the Station row of Project Settings > Display. |
| STA_US | Station at the upstream end of the pipe, in the same "+" notation. Read-only. Same display-precision row as STA_DS. |
| Length | Pipe length (ft). Read-only. |
| Shape | Circular or Box. Editable via dropdown: switching to Box enables the Span column; on Apply, the pipe swaps to a matching part family in Civil 3D. |
| Span | Box span (inside width, ft). Editable on Box pipes only (blank/inactive for circular); pushed to Civil 3D as the nearest catalog box size on Apply. |
| Size | Pipe size: diameter in inches for circular pipes (picked from the active part family's catalog sizes), or rise (inside height, ft) for box pipes (typed directly). Note: for box pipes, the Diameter field elsewhere mirrors this Width/Span value. |
| Mannings n / Hazen-Williams C | Friction coefficient. The header switches between "Mannings n" and "Hazen-Williams C" depending on the project's Friction Method setting. Editable per pipe. |
| Slope % | Pipe slope (%). Editable; holds the downstream invert fixed and recomputes the upstream invert. |
| Inv_DS | Downstream invert elevation (ft). Editable. |
| Inv_US | Upstream invert elevation (ft). Editable. |
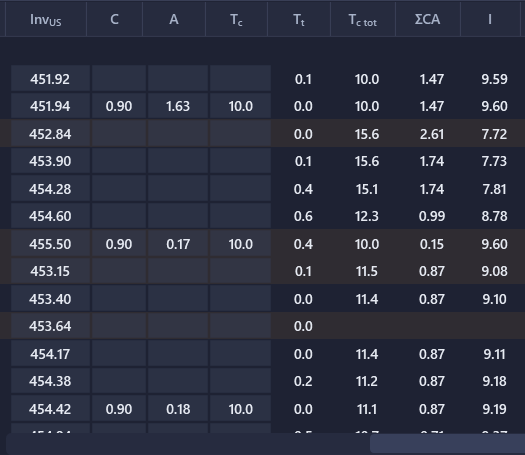
| C | Local runoff coefficient at the upstream structure. Only present when a rational hydrology mode is active (Manual, or HydraLink on the Basin Parameters basis); hidden entirely in Peak Flows Only and on the HydraLink Fixed Flows basis. Editable in Manual mode only (blank reverts to the project default); in HydraLink mode the value is basin-derived and read-only here: edit it in the Hydrology Table, or convert the node to Manual there. |
| A | Local drainage area (ac) contributed at the upstream structure. Same visibility and editability rules as C. |
| Tc | Local inlet time of concentration at the upstream structure (min): travel time for overland flow to reach this structure, not the accumulated system value. Same visibility and editability rules as C. See Tc_tot below for the controlling system Tc, or hover the Q_tot cell for the full Q=CIA breakdown. |
| Tt | Travel time through this pipe (min), computed from pipe length and the travel-time velocity basis set in Project Settings > Storm Drain. Read-only. Blank when Enable Travel Time Adjustment is off. See Rational Method. |
| Tc_tot | Controlling system time of concentration at the upstream structure (min): the greater of the local Tc or (upstream Tc_tot + Tt) along every upstream path. This is the duration used to look up intensity. Read-only. |
| ΣCA | Accumulated C·A at the upstream structure (acres): the local C·A plus every upstream contribution, laterals included. This is where a lateral's accumulation becomes visible on the main run, since C and A stay local. Read-only, rational modes only. Q_tot = Cf × ΣCA × I closes against this column except where inlet capture, a carried-down upstream Q, or the rational conversion factor moves the final flow (see What Enters the Rational Accumulation). |
| I | Rainfall intensity (in/hr) from the project's IDF data at Tc_tot, for the currently selected storm. Decreases moving downstream as Tc_tot grows. Read-only. |
| Q | Local design flow added at the upstream structure (cfs). Editable; sets the upstream node's design flow. Shown only in Peak Flows Only mode and on the HydraLink Fixed Flows basis, where an entered or imported flow is what drives the network. In a rational mode the column is hidden entirely, because a typed flow contributes nothing there (see What Enters the Rational Accumulation) and Q_tot already reports the computed flow. |
| Q_tot | Total accumulated flow through the pipe (cfs): local flow at the upstream structure plus all upstream contributions. Read-only. Hover the cell for the Q = CIA breakdown when a rational mode is active. It also names a defaulted C or inlet time (e.g. "local C = 0.70; project default, not entered") so a blank basin doesn't read as a considered value. A structure with no tributary area shows a weighted C of 0, not the project default. |
| hb | Curved-alignment (in-barrel) head loss on curved pipe, per the active design standard's curve-loss channel (ft). Read-only; hover for a formula breakdown. Only present when the standard defines that channel; most don't, so this column is usually absent rather than blank. |
| Q_f | Full pipe capacity (cfs) under uniform flow conditions. If Q_tot > Q_f, the pipe is over capacity. Read-only. |
| V_ds | Actual velocity at the downstream end (ft/s): Q over the flow area at the HGL depth, capped at full barrel. Read-only. (Full-pipe velocity remains available in the Excel export and profile tooltip.) |
| V_us | Actual velocity at the upstream end (ft/s), on the same actual-depth basis as the EGL. Read-only. |
| S_f | Mean friction slope S_f = h_f / L (ft/ft). Never negative. Read-only. |
| h_f | Friction head lost along the barrel (ft): S_f·L flowing full, or the friction loss along the computed water surface on a partial-flow pipe. Read-only. |
| h_jump | Energy lost in a hydraulic jump inside this pipe (ft). Blank when there is none; the profile marks the jump HYD JUMP. Shown under the gradually-varied-flow method only. |
| K_j | Effective junction loss coefficient at the upstream structure, from the assigned loss type's lookup/expression or a manual override. Read-only here; set the type or override in the property panel or the Minor Losses table. See Junction Losses for how it's computed. |
| h_j | Junction head loss (ft) at the upstream structure. Hover the cell for a formula breakdown. Read-only. |
| HGL_DS | HGL at the downstream end of the pipe barrel (ft). Read-only on ordinary pipe rows; edit it on the synthetic boundary row at the top of each alignment group instead, to manually set the downstream HGL (e.g. pond/river water surface, or the crown of the pipe at a lateral). See HGL Override below. |
| HGL_US | HGL at the upstream end of the pipe barrel (ft). Read-only. |
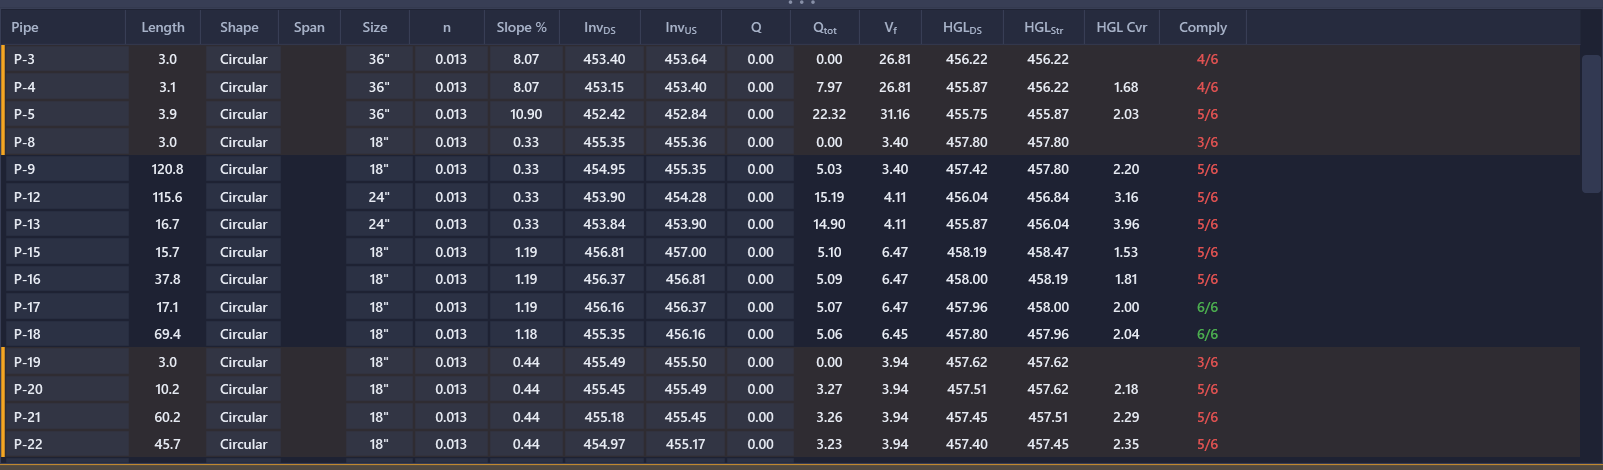
| HGL_Str | HGL at the upstream structure after junction (K_j) losses (ft). Read-only. |
| HGL Cvr | Distance from ground/rim to HGL at the upstream structure (ft). Positive = freeboard below ground; negative = flooding. Read-only. |
| Comply | Design-criteria compliance score (pass/total), e.g. "4/6". Hover for details on each check; "ack" indicates acknowledged failures. Read-only. |
Note: The Pipe and STA_DS columns are frozen: they stay pinned to the left edge of the grid as you scroll horizontally through the rest of the columns, so you always know which pipe row you're looking at.
Note: The C, A, Tc, Tt, Tc_tot, ΣCA, and I columns only appear when a rational hydrology mode is active (Manual, or HydraLink on the Basin Parameters basis); otherwise they're removed from the grid rather than shown blank. The local Q column is the mirror image: it appears exactly when those columns don't. The inlet ledger's own literals (Capture and CAin) are inlet facts and are read on the Inlet tab and in the Excel storm calcs sheet, not on this grid. See Rational Method for how these values are computed.
Design Columns Only
A large results grid can get busy once every intermediate hydraulic column is visible. From the View menu, check Design Columns Only to hide the intermediate detail columns (STA DS, STA US, Q_f, S_f, h_f, K_j, h_j, HGL_US, the jump-loss column h_jump, and, when the active design standard defines a curved-pipe loss channel, h_b), leaving the editable inputs plus Q_total, V_ds, V_us, HGL_DS, HGL_Str, HGL Cover, and Comply. This is the set most engineers need for day-to-day design review; switch back to the full column set to dig into friction/junction loss detail or to troubleshoot a specific HGL jump.
The rational-method hydrology block (C, A, Tc, Tt, Tc_tot, ΣCA, I) is exempt from this preset: when a rational hydrology mode is active, all seven stay visible whether or not Design Columns Only is checked, since they're design inputs (or, for Tt/Tc_tot/ΣCA/I, the reason intensity and Q change from pipe to pipe).
The preset is a per-user preference: it's remembered across sessions and applies to every project you open, not saved with the .hsp file. Uncheck Design Columns Only to restore every column.
Color Coding
Rows in the results table (dark theme) carry a left severity stripe plus a light color wash to help you quickly identify design issues, without the flagged rows becoming muddy against the dark background:
| Indicator | Meaning |
|---|---|
| No stripe | Normal: no warnings or errors on this pipe. |
| Amber stripe/wash | Warning: the pipe is approaching a design limit. Examples: velocity slightly below minimum, HGL near the pipe crown, marginal cover. |
| Red stripe/wash | Error: a design criterion is violated. Examples: HGL above rim (overtopping), velocity exceeds maximum, pipe over capacity (Q_tot > Q_f), insufficient cover. |
Hover over a flagged row to see a tooltip with the specific warning or error description. The HGL Cvr and Comply cells also tint/color independently based on their own pass/fail state (see Compliance Checking).
Alignment Grouping
Results are grouped by alignment name. Each alignment appears as a collapsible header row in the grid. Click the header to expand or collapse the pipes in that alignment. This keeps large networks organized and makes it easy to focus on one run of pipes at a time.
Editing Cells
The Pipe name, Shape, Span (box only), Size, Mannings n / Hazen-Williams C, Slope %, Inv_DS, Inv_US, and Q (in the modes that show it, Peak Flows Only or the HydraLink Fixed Flows basis) columns are editable directly in the grid, Excel-style. The rational-method C, A, and Tc columns are also editable, but only in Manual hydrology mode; in HydraLink mode they carry basin-derived values and reject inline edits.
Box Span Editing
Setting a pipe's Shape to Box enables the Span column for that row and switches the Size cell's editor to a typed rise (inside height, ft) instead of a diameter dropdown. On Apply, HydraStorm swaps the pipe to the nearest matching box part family and size in the Civil 3D parts list. In the property panel, a box pipe's Diameter field mirrors its Width/Span value.
Type-to-Edit
With an editable cell current (selected but not yet in edit mode), just start typing: the cell enters edit mode immediately and replaces its contents with the typed character. F2 and double-click still work if you'd rather edit the existing value in place. The Size and Shape cells use their dropdown editors instead, so typing doesn't apply there. Read-only rows (boundary rows other than HGL_DS, and merged splice-stub rows) don't respond to typing or F2.
Invalid-Input Feedback
If an edit is rejected (a non-numeric value, a duplicate pipe name, or a boundary HGL below the downstream invert), the cell flashes red, the status bar shows the reason, and the cell stays in edit mode so you can correct it immediately. Press Esc to abandon the edit and revert to the previous value.
HGL Override
Each alignment group has a synthetic boundary row at the top, above the first pipe row. Its HGL_DS cell is the one editable HGL_DS in the grid: click it, type a new elevation value, and press Enter to manually force the downstream boundary condition for that alignment (an outfall water surface, a pond stage, or the crown of the receiving pipe at a lateral tie-in). The HGL calculation propagates upstream from your overridden value. Every column on ordinary pipe rows below it is computed and read-only.
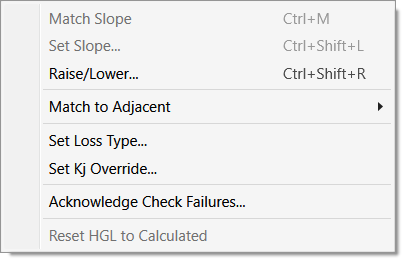
To clear a manual HGL override and revert to the calculated value, right-click the pipe row and select Reset HGL to Calculated. The downstream boundary condition will be recalculated using the project's default method (normal depth, user-specified elevation, or (Dc + D) / 2).
Note: HGL overrides are preserved when you save the project. They are useful for modeling known tailwater conditions at outfalls, such as a detention pond water surface elevation or a channel flood stage.
Selection
Click a row in the results table to select that pipe. Selection is synchronized across all three panels:
- The pipe is highlighted in the profile view.
- Its properties appear in the property panel.
- The row is highlighted in the results table.
You can select multiple contiguous rows by holding Shift and clicking. Multi-selection enables batch geometry editing via the right-click context menu on the profile or grid, such as Raise/Lower (Ctrl+Shift+R) and Match Slope / Multi-Match (Ctrl+M) among them. These are context-menu commands, not property-panel controls; see Pipe Editing.
Tip: Quick Review Workflow
- Sort by the HGL_Str column to find the highest HGL values first.
- Look for red rows to quickly locate design violations.
- Click a problem row to jump to it in the profile view and start editing.