Excel Export
Export calculation results for verification, submittal, or documentation.
Opening the Export Dialog
The Storm Calcs Excel workbook export is launched from the Output toolbar menu → Export > Excel Workbook..., which opens the column-layout dialog described below before writing the workbook.
CSV export was removed in September 2026. The storm drain and inlet CSV dumps (and the Ctrl+E shortcut) are gone. The workbook covers the same ground through the same column layout, with live formulas, proper headers and a sheet per storm. The CSVs were a poorer second copy of one export. Excel can still save any sheet as CSV if you need one for another tool.
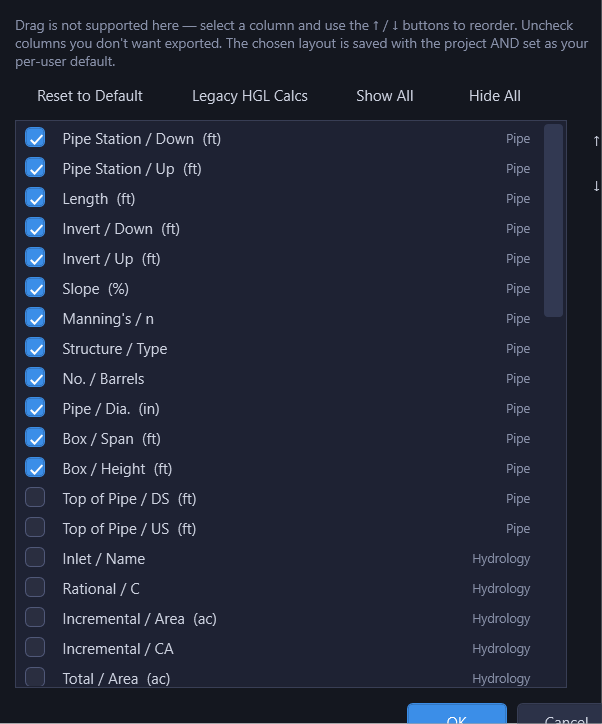
Column Configuration
The export dialog shows all available output columns with checkboxes. You can:
- Toggle individual columns on/off using the checkboxes
- Reorder columns using the Up/Down arrow buttons
- Reset to Default to restore the standard column layout
- Legacy HGL Calcs to switch to the classic Computation Sheet column order (see below)
- Show All / Hide All for quick selection
Your column layout is saved with the project and also becomes the default for new projects.
Legacy HGL Calcs Preset
Click Legacy HGL Calcs in the export dialog to switch the column order and visibility to match the classic Computation Sheet workbook many firms have used for years: stations, hydrology, design and check storm intensity/Q, pipe geometry, HGL, headloss, inverts, Tc, and a comments column, in that order.
The preset also adds five columns to the export that the standard Storm Calcs layout doesn't otherwise carry:
- Frequency Factor: the Cf multiplier applied to the rational method Q
- Check Intensity: check-storm rainfall intensity at this pipe's Tc
- Check Q: check-storm peak flow
- Bypass Q: inlet bypass flow leaving this inlet (populated when the inlet module is enabled)
- Comments: a blank, editable cell for reviewer notes
These five columns are added at the end of the workbook rather than inserted in the middle, so a column layout you saved in an older HydraStorm version still opens correctly: existing projects pick the new columns up automatically the next time you open the export dialog.
Export Formats
Excel Export (Storm Calcs Workbook)
The workbook is built entirely by HydraStorm: there's no underlying spreadsheet template. Every header stamp, formula, and lookup table is generated fresh from your project data, so the layout always matches what HydraStorm actually calculated. The Storm Calcs sheet includes:
- Project & standard stamp: Project, Engineer, Standard, Criteria, Storms, and IDF Source rows in the top-left, on every export regardless of hydrology mode
- Storm coefficient block: rational-method projects only; see below
- Data organized by alignment, trunks before tributaries. Each block's title names the run and the storm it reports (
LINE A - 100-YR Design, or… / 25-YR Checkwhen the check storm is on and a check-storm column is shown), matching the title the drafted CAD table carries - One Storm Calcs sheet per storm. Storm Calcs is the design storm, with the check storm's flow columns beside it as the layout shows them. Every other storm the Storm Drain storm grid runs (the check storm and each analysis storm) gets its own full sheet (Storm Calcs 25-YR, Storm Calcs 50-YR, …) with that storm's hydraulics, its own IDF coefficients driving the live chain, and its block titles naming it (
LINE A - 25-YR Check). Check-storm columns are hidden on those sheets. The Storms line in every sheet's stamp lists every storm the workbook holds, and on a per-storm sheet says which one that sheet is - Configurable column layout matching your dialog selections
- A generated Loss Coefficients sheet driving the live junction-loss lookup, described below
Stations render in plan-and-profile "+" notation (e.g. 12+34.56) on the Storm Calcs sheet's station columns, on the drafted storm-calcs CAD table in the drawing, and in the results grid alike. In the workbook the station cell stays a real number underneath, just displayed with the "+" format, so the sheet's live chains still work off it: Length is a formula that subtracts the two station cells. The digits after the plus follow the Station row of Project Settings > Display (two by default); the "+" itself is fixed.
Storm Coefficient Block
What appears in the header depends on the project's hydrology mode:
- Rational method with fitted IDF coefficients: a small block holds the design storm's IDF coefficients b, d, e for
i = b / (Tc + d)^eand, when a check storm is enabled, the check storm's coefficients and frequency factor (Cf). The Intensity column reads these cells live, so a reviewer can tweak a coefficient in the header and watch Q recalculate down the sheet. - Rational method with table-interpolated IDF: when the project's IDF data has no fitted coefficients (interpolation is reading the intensity table directly), there's no equation to put in a cell. The Intensity column instead carries HydraStorm's interpolated values as light-yellow literals; Q formulas downstream still multiply through them live.
- Peak-flow-only projects: no storm coefficient block at all. Flows are entered per inlet in the Individual Q column, and Total Flow is a live running sum down each alignment.
What the Live Formulas Carry
The point of the live chains is that you can change an input in the workbook and every number below it follows. For that to be trustworthy the chains have to land where HydraStorm landed, so each one carries the same rules the engine uses:
- Time of concentration is a maximum, not an override. A structure's Total Time is the larger of its own inlet time and every upstream path into it (the upstream row's Total Time plus that pipe's travel time). An inlet with a short inlet time below a slow basin does not reset the system Tc. At a confluence the formula includes each lateral's path as well, so a lateral carrying the governing time of concentration reaches the trunk.
- Every accumulating column crosses a confluence: cumulative area, cumulative C·A, and the check storm's own cumulative C·A and area pick up the laterals the same way the design chain does. In a direct-flow (peak-flow) project the check storm gets its own per-row input too: a hidden Q indv (chk) column (the check-period peak entered at each structure,
IndvQ's twin) accumulates into Check Q the same way the design Individual Q accumulates into Total Flow. Before this change, Check Q was a flat literal on every row in direct-flow projects, so editing a check-period flow moved nothing. - Intensity is rounded to two decimals, matching the published IDF tables and the municipal worked examples the sheet is checked against, and it is held at the project's minimum time of concentration (and at the curve's fitted window, when the curve records one) exactly as the results grid does.
- The check storm has its own hidden time-of-concentration chain. A check storm carries more flow than the design storm, so on the default velocity basis (V = Q/Afull) it travels faster: shorter travel times, a shorter system Tc, higher intensity, higher Q. Two columns, Tt (chk) and Total Time (chk), carry that chain in parallel with the design one (wired across confluences the same way), and the Check Intensity formula reads Total Time (chk) rather than the design Tc. Both are hidden by default in the export dialog's column list (turn them on there to see the chain), but it means a reviewer changing an upstream Tc or travel-time input sees the check Q respond correctly, on its own Tc, not the design storm's.
- In a peak-flow project with inlet capture coupled to the design storm, the running design-storm flow sums what actually entered the pipe system at each structure, not the peak you entered there. Two extra columns state the ledger: Q in (what entered) and Byp in (carryover arriving from upstream inlets), so entered Q + carryover in − bypass out = Q in reads directly off the row. These two columns are gated on inlet capture actually being coupled into the design storm (the per-storm Inlet column on the Storm Drain storm grid, see Storm Events). With coupling off, the engine assumes full interception everywhere, so there is nothing distinct from the peak to state, and the cells stay blank rather than repeat the peak. Coupled check-storm capture has no equivalent live ledger column: Check Q stays a HydraStorm literal there rather than summing peaks that aren't what actually entered.
A handful of rows fall back to a HydraStorm-computed literal instead of a live formula, because no cell formula can express what happened there:
- A structure that splits flow among several outgoing pipes: each leg carries its own share of the cumulative area and C·A, not the whole upstream total.
- A routed pond outflow that replaces the arriving upstream flow rather than adding to it. Every row below picks up the corrected total from that literal.
- A row where the project's non-decreasing-flow option makes the walk carry the arriving flow forward instead of computing C·i·A locally, because the formula would reproduce the product the option exists to suppress.
- Travel time and Total Time (design and check) on the Manning full-barrel velocity basis, because the engine takes velocity from pipe geometry and slope there, which isn't a formula this sheet's cells can reach, so both columns degrade to literals rather than publish a confidently wrong live chain. (Total Time stays a live maximum over those literals, so an inlet-time edit still moves everything downstream.)
Loss Coefficients Sheet
When the project has an active design standard, the workbook writes a Loss Coefficients sheet listing every loss label from that standard: its published K value, the loss equation form (K·Vo²/2g or the compound form), and the source loss type for traceability. The Storm Calcs sheet's Junction Kj cell is a live VLOOKUP against this sheet, and the Structure Loss cell picks the matching equation form by label, so a reviewer can change a row's loss label in Storm Calcs and the workbook recalculates the loss without reopening HydraStorm.
Loss types that don't reduce to a simple K-times-velocity-head form (HEC-22 and iSWM compound-K junction methods, complex expressions) can't round-trip through a lookup cell. For those nodes (and for the whole sheet when the project has no design standard, or none of its loss types fit the lookup form), the loss cells carry HydraStorm's computed values directly as light-yellow literals instead of a live formula, and no Loss Coefficients sheet is written in that all-literal case.
Print-Ready Formatting
Headers, titles, and data cells are white-filled with black text and thin borders throughout, deliberately so a range copy-pasted into CAD plots readable instead of carrying dark Excel theme fills. The only colored cells are the review highlights, explained in an on-sheet legend next to the storm block:
- Red: HGL above rim or top of curb
- Amber: HGL within the project's HGL cover distance of rim
- Orange: flow exceeds pipe capacity
- Blue-grey: partial (free-surface) flow at that pipe
- Light yellow: HydraStorm wrote a computed value in place of a live formula (gradually-varied-flow water surface, a compound loss method, table-interpolated intensity, etc.)
Every sheet is also set up landscape and fit to one page wide, so printing or exporting to PDF for a submittal doesn't require touching the page setup first.
Additional Sheets
Besides the Storm Calcs sheets, the workbook always includes a Quantities sheet (pipe length by size/material/cut-depth and structure counts). A Loss Coefficients sheet is added whenever the project has an active design standard with at least one loss type simple enough to round-trip through a lookup cell (see above). Beyond those, sheets appear in this order whenever the corresponding results exist:
- Culvert Calcs: whenever culvert results exist.
- Inlet Summary, written first among the inlet sheets: a per-run rollup and project total closing the gutter ledger (runoff, carryover in, capture, carryover out, unrouted, and an in = out check), the exception list (one row per engine warning, verbatim), and an inlet-type schedule.
- Inlet Calcs: one column layout shared with the Inlet tab's results grid and the drafted inlet CAD schedules; configure it once from the Inlet tab's Columns... button. Each alignment block ends with a run-ledger footer (runoff, carryover in, capture, carryover out, unrouted, in = out) matching the Inlet Summary sheet's numbers for that run. Carries live formulas, described below.
- Inlet Calcs (Check): added whenever check-storm inlet results exist, under the same rule that puts a check-storm inlet CAD schedule in the drawing, so the workbook and the drafted tables never disagree about which storms were reported. Live formulas as well.
- Compliance: leads with a per-criterion pass/fail table, then the same review data as the results grid's Comply column.
What the Inlet Calcs Live Formulas Carry
Like the Storm Calcs sheet, Inlet Calcs and Inlet Calcs (Check) carry live formulas rather than plain values. Each row recomputes from its own cells: edit an input, for example C, i, A, a slope, an opening length or a coefficient, and the numbers after it on that row follow.
- Local Q: Cf × C × i × A, in a rational hydrology mode.
- Carryover in: the sum of the Bypass Out cells of the inlets whose carryover reaches this one.
- Depth at curb, gutter velocity and street capacity: from the spread.
- Curb openings and slotted drains: Eo, Se, LT and captured flow.
- Grates: Eo, Rf, Rs, frontal and side flow, and captured flow.
- Combination inlets: the curb opening upstream of the grate (the sweeper) first, then the grate on what's left.
- Sag inlets: ponding depth, weir and orifice capacity, ponded spread, weir perimeter and orifice area for curb openings and slots, capacity at the allowance, and required length.
- Every row: bypass out, efficiency, and the OK/CHECK verdict.
A few things stay HydraStorm values rather than formulas, because there's no equation for a formula to restate:
- Every spread cell: the roadway spread, the spread in the depressed pan that Eo reads, and the spread reaching a combination inlet's grate. Spread on a depressed, composite or V gutter section has no closed-form equation, so the formulas start from HydraStorm's own spread cell.
- The section and opening inputs and the allowances.
- The Warnings text.
- The row's red or yellow shading. That's HydraStorm's verdict at export time and doesn't move when you edit a cell.
A handful of cells go further and are marked italic: HydraStorm's own value where the method it used has no cell formula. A legend line above the column headers says so whenever a sheet has any. These are:
- A sag inlet whose weir-to-orifice transition blends across a band rather than switching at a single depth.
- A combination inlet in a sag, which drowns its curb opening and its grate opening at two different heads.
- A grate's Eo on a V-shaped gutter section.
- A combination inlet whose curb opening earns a credit alongside the grate.
The sheet writes every column in the layout, not only the ones you've turned on: visible columns come first, then every other layout column hidden to the right of them, because the formulas read inputs a layout may not display (Eo's spread, gutter pan slope and width, throat height, weir and orifice coefficients, and the rest). Unhide a column in Excel to inspect the chain behind it. Turning a column off in the Inlet tab's Columns... picker moves it into that hidden block rather than dropping it, so a formula that reads it keeps working.
The drafted CAD inlet schedules and the Inlet tab's results grid are unchanged: both still show plain values.
Tip
The Excel export is designed to match the traditional storm drain calculation spreadsheet format that many engineers are familiar with. Use it to verify HydraStorm's calculations against your existing spreadsheet methods, or include it in your drainage report submittal.
Still want a spreadsheet? HydraStorm doesn't force you to abandon your review process. Click Export and you have a full Storm Calcs workbook ready for QA/QC or submittal, with no manual data entry required.